
Figures & data
Figure 1. Definition of factors influencing the implementation of HRAL.
Figure 2. Assembly line evaluation map based on automation and flexibility.
Figure 3. Framework for analysing HRAL component features and system features.
Figure 4. Skillsets of components on HRAL.
Table 1. Interrelationship between component features and system features of HRAL.
Figure 5. Cognitive map showing the causal relationships between component features and system features of HRAL.
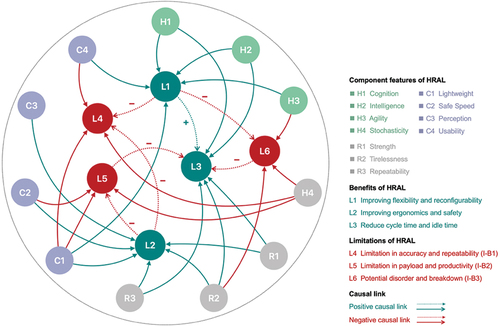
Figure 6. Diagram of the Triple-I framework and causes of barriers to HRAL implementation.
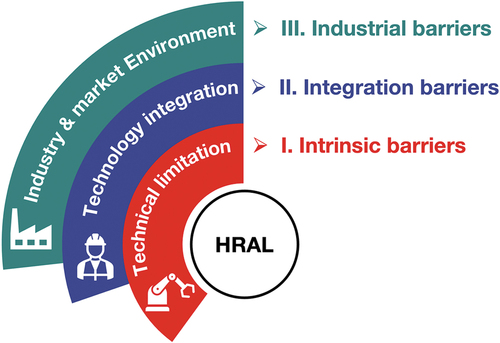
Table 2. Barriers of HRAL implementation based on the Triple-I framework.
Figure 7. Proposed integrated MCDM model for HRAL implementation.
Table 3. Details of experts.
Table 4. Alternatives of HRAL configuration.
Table 5. Linguistic terms and rating (Lo et al. Citation2019).
Table 6. The weights of main categories.
Table 7. The local weights of barriers.
Table 8. Final ranking of the sub-barriers for implementing HRAL.
Table 9. Initial evaluation matrix for HRAL configuration alternatives.
Table 10. Weighted normalised decision matrix.
Table 11. Separation distance and relative closeness of alternatives.