Figures & data
Table 1. Median values of 25(ОН)D concentration changes in PB based on daily intake according to GrassrootsHealth algorithm (A Public Health Promotion Organization http://www.grassrootshealth.net).
Figure 2. VDR expression in glands and stroma of eutopic endometrium – secretory phase. IHC test × 400.
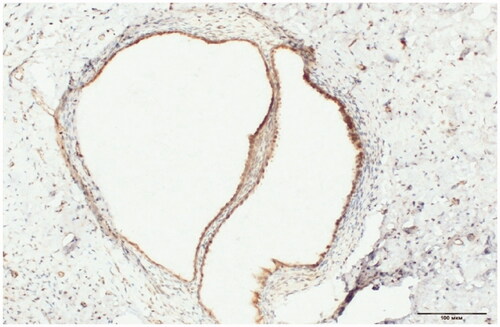
Figure 3. VDR expression in endometrioid heterotopias. IHC test × 200.
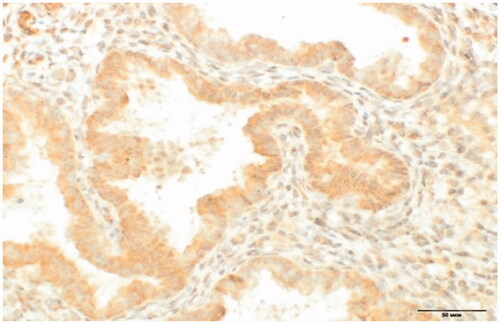
Table 2. Estimation of VDR expression in endometrioid heterotopias and the endometrium of patients with GE and in the endometrium in patients from the control.
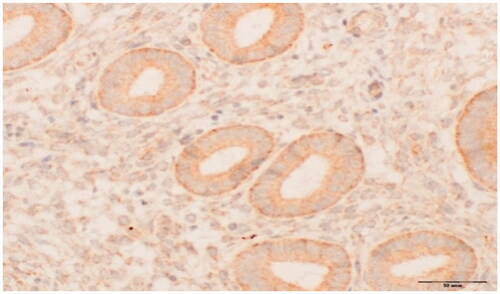
Figure 1. VDR expression in glands and stroma of eutopic endometrium – proliferative phase. IHC test × 400.