
Figures & data
Table 1. Allele flanking and specific primer sequences and their respective PCR product sizes.
Table 2. Demographic and clinical variables between normotensive (control) and preeclamptic (cases) patients.
Table 3. Frequency and percentage distribution of different study parameters.
Figure 1. Genotype distribution among the two study groups.
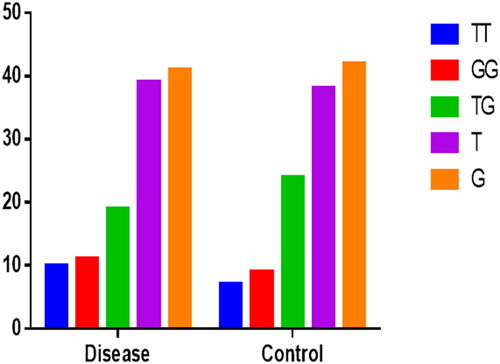
Table 4. VDR ApaI (rs7975232) genotypes distribution based on different study variables.
Table 5. Regression analysis of study variables between disease and control group.
Table 6. Hardy–Weinberg equilibrium between disease and control group.
Supplemental material
Supplemental Material
Download Zip (77.2 KB)Data availability
Available from the corresponding author on reasonable request.