Figures & data
Figure 1. Increased Fe deposition in PCOS mice model with unexplained liver damage. (A) The ovarian tissue change demonstrated by HE staining; (B) the hormone change of PCOS mice; (C) HE staining of liver tissue and serum TG, Choline, ALT, AST changes; (D) Prussian blue staining of liver Fe deposition and Serum/liver Fe content analysis. The white arrowhead indicates the accumulated Fe in the liver. The DHEA group in this figure equals PCOS group. *p < .05; **p < .01.
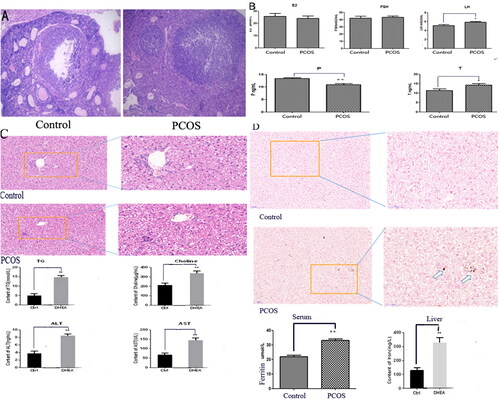
Figure 2. MiR-761-hepcidin/GPX4 pathway and the involvement of ferroptosis in PCOS mice model with unexplained liver damage. (A) Change of serum and liver hepcidin in mRNA and protein level; (B) Relative miR-873-5p and miR-761 levels between PCOS and control (left panel), the confirmation of miR-761 regulating on hepcidin by both bioinformatics prediction and luciferase analysis (right panel); (C) mRNA levels of GPX4, ACSL4, PTGS2 and FSP1 in control and model groups (with HFD, DHEA and HFD + DHEA); (D) Relative protein levels of GPX4, ACSL4 and PTGS2 in control and model groups (with HFD, DHEA and HFD + DHEA); (E) the confirmation of miR-761 on GPX4 by both bioinformatics prediction and luciferase analysis; (F) the change of GPX4 and hepcidin after miR-761 antagonizing and overexpression. *p < .05; **p < .01.
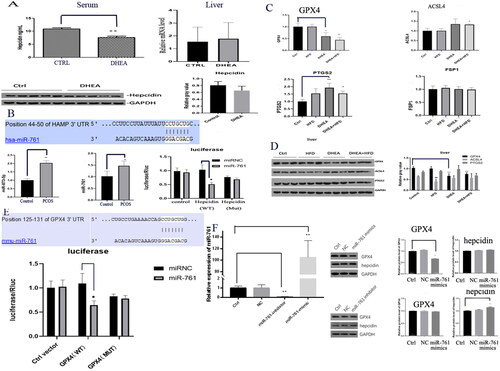
Figure 3. The serum (A) and tissue Prussian Blue staining (B) markers showing the existence of liver Fe deposition and dysfunction. Control group (A), PCOS group (B), NC-antagomir + PCOS group (C) and miR-761-antagomir + PCOS group (D). *p < .05; **p < .01.
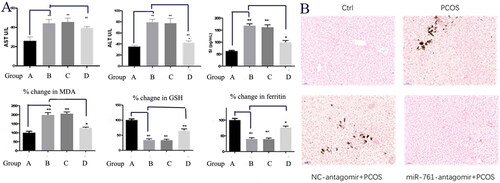
Figure 4. Serum and liver markers of inflammation (A) and ferroptosis (B) showing the existence of ferroptosis and inflammation. Ctrl group (A), NC-mimic group (B), NC-antagomir + PCOS group (C) and miR-761-antagomir + PCOS group (D). *p < .05; **p < .01.
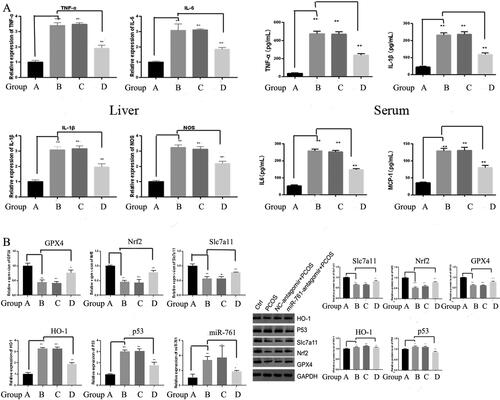
Figure 5. The effect of miR-761 on Fe deposition in L02 cell model. (A) Change of miR-761 relative mRNA (left panel) and OD (right panel) levels after different reagents; (B) mRNA (left panel) and protein (right panel) levels of TNF-α; IL-6; IL-1β; MCP-1 by qRT-PCR and ELISA methods. Ctrl group (A), NC-mimic group (B), miR-761+ mimic group (C), DMSO + miR-761-mimic group (D), DFO + miR-761- mimic group (E) and Fer-1 + miR-761-mimic group. *p < .05; **p < .01.
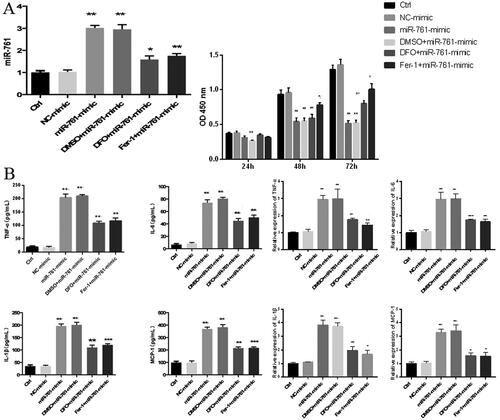
Figure 6. The effect of miR-761 on ferroptosis and the liver pathology change after different reagents interference. (A) Changes of GPx4, Nrf2, SLC7A11, HO-1 and P53 levels after different mixture of miR-761 interference; (B) the liver pathology change after different reagents interference as shown by both H-E (left panel) and Prussian Blue (right panel) staining. Ctrl group (A), PCOS group (B), vehicle + PCOS group (C), NC agomir + vehicle + PCOS group (D), miR-761 agomir + vehicle + PCOS group (E), Fer-1 + PCOS group (F), NC agomir + fer-1 + PCOS group (G) and miR-761 agomir + fer-1 + PCOS group (H). *p < .05; **p < .01.
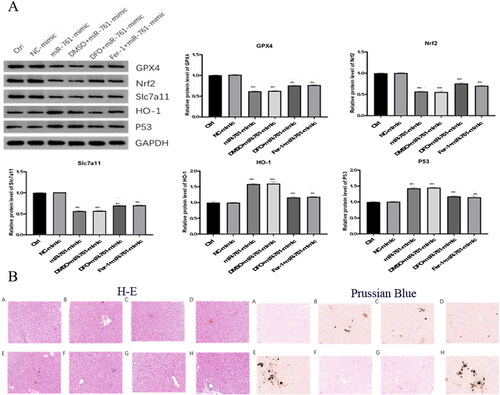
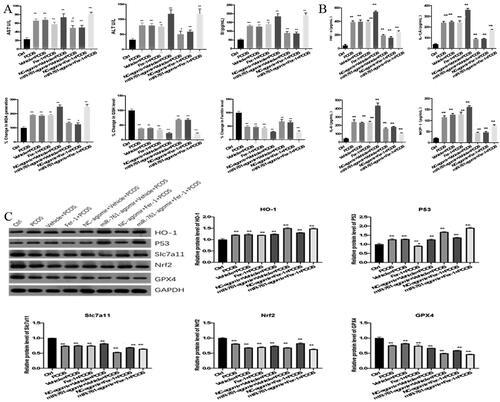
Figure 7. The Role of ferroptosis and miR-761 in POCS mice model with unexplained liver dysfunction. (A) change of AST, ALT, SI, ferritin, GSH and MDA levels in different groups as shown by ELISA method; (B) change of TNF-α, IL-6, IL-1β and MCP-1 levels in different groups as shown by ELISA method; (C) change of GPx4, Nrf2, SLC7A11, HO-1 and p53 protein levels in different groups as shown by Western blot. *p < .05; **p < .01.