
Figures & data
Figure 1. Flow chart of the study design.
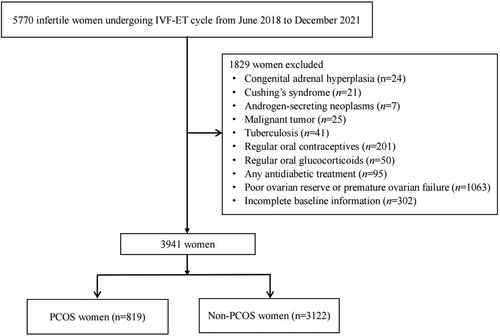
Table 1. Baseline characteristics in PCOS and non-PCOS women.
Table 2. Prevalence ratios for MetS according to the tertiles of TyG index.
Table 3. Odds ratios for metabolic risk factors based on tertiles of TyG index in PCOS and non-PCOS.
Figure 2. Receiver operating characteristic curves for the detection of MetS using various metabolic parameters.
Abbreviations: TyG index, triglyceride-glucose index; FBG, fasting blood glucose; TG, triglycerides; HDL, high-density lipoprotein; LDL, low-density lipoprotein; HOMA-IR, homeostasis model assessment of insulin resistance
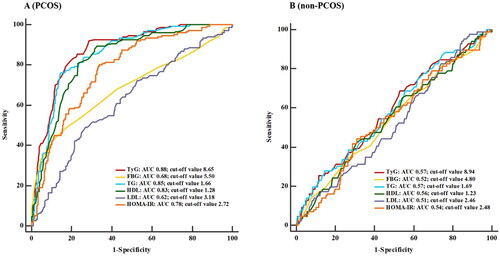
Table 4. AUC, Cutoff points, sensitivities, specificities, positive and negative predictive values of various biomarkers for MetS.
Data availability statement
Some or all datasets generated during and/or analyzed during current study are not publicly available but are available from the corresponding author on reasonable request