
Figures & data
Table 1. Baseline clinical and biochemical parameters in PCOS-IR, PCOS-non-IR, and control groups.
Figure 1. Sample expression correction box diagram and volcano diagram. A: Protein expression before normalization. B: Protein expression after sample normalization. The red sample represents the PCOS-non-IR group, the green sample represents the PCOS-IR group and the blue sample represents the control group. C: PCOS vs. Control. D: PCOS-IR vs. PCOS-non-IR. (Red dots represent up-regulated differential proteins, green dots represent down-regulated proteins, and no significantly changed genes are marked as gray dots).
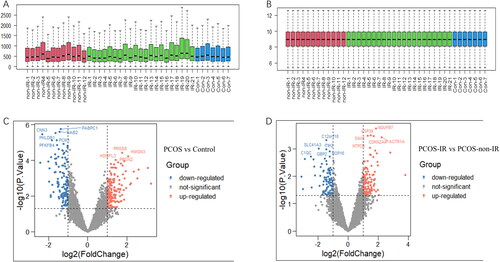
Figure 2. PCOS vs. Control: GO and KEGG enrichment of differentially expressed proteins (DEPs). (A) biological process, (B) cellular component, (C) molecular function, and (D) KEGG pathway analysis.
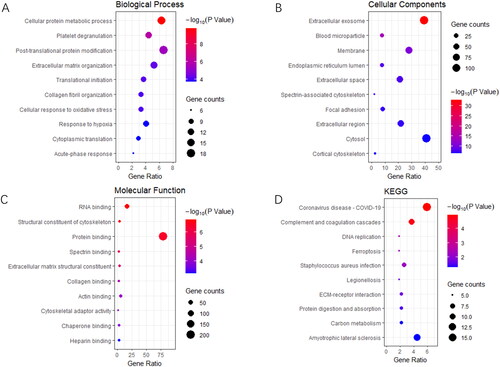
Figure 3. PCOS-IR vs. PCOS-non-IR: GO and KEGG enrichment of differentially expressed proteins (DEPs). (A) biological process, (B) cellular component, (C) molecular function, and (D) KEGG pathway analysis.
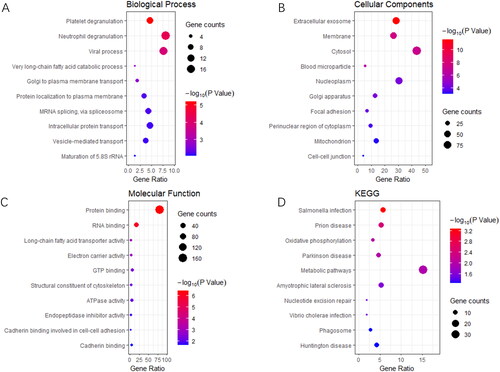
Figure 4. A: Venn diagrams to visually display the intersection of differential proteins between PCOS vs. control and PCOs-IR vs. PCOs-non-IR groups. B: PCA between the PCOS-IR, PCOS-non-IR and control groups. The red sample represents the PCOS-non-IR group, the green sample represents the PCOS-IR group and the blue sample represents the control group. C and D: The LASSO regression model for live birth of PCOS-IR patients. E: ROC of different factors on pregnancy outcome.
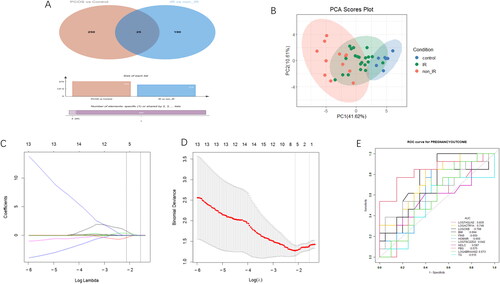
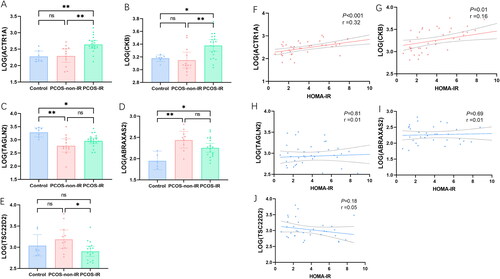
Figure 5. Analysis of key proteins expression: (A, B, E) ACTR1A and CKB were higher in PCOS-IR group, while TSC22D2 was lower in PCOS-IR group (p < .05). (C and D) ABRAXAS2 was higher in all PCOS groups and TAGLN2 was low in all PCOS groups (p < .05), but there was no difference between the PCOS-IR and PCOS-non-IR groups (p > .05). Pearson correlation analysis between key proteins and HOMA-IR: (F and G) ACTR1A and CKB was significantly positively correlated with HOMA-IR. (H, I, and J) there was no significant correlation between TAGLN2, ABRAXAS2 and TSC22D2 with HOMA-IR.
Supplemental Material
Download MS Word (20 KB)Availability of data and materials
The Trial data used in this manuscript have been deposited to the Proteome Xchange Consortium (http://proteomecentral.proteomexchange.org) via the iProX partner repository with the dataset identifier PXD032383.