Figures & data
Figure 1. Content of cinnamic acid and paeonol in GZFLW. (A) Cinnamic acid reference. (B) Cinnamic acid in the sample. (C) Paeonol reference. (D) Paeonol in the sample.
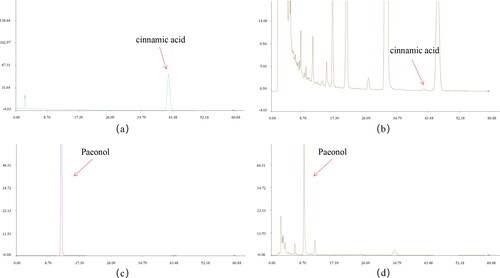
Figure 2. GZFLW downregulates H19 and upregulates miR-29b-3p. (A and B) Correlation between H19 and miR-29b-3p. (C) H19 mRNA. (D) miR-29b-3p mRNA. #p < .05, ##p < .01 in comparison with controls, **p < .01 in comparison with model.
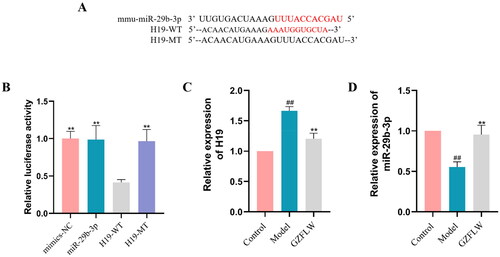
Figure 3. GZFLW downregulates PTEN, MMP-2 and Bax protein expression. (A–D) Luciferase assay identified the correlation between miR-29b-3p and PTEN, MMP-2 and Bax. (E–H) Western blot analysis of PTEN, MMP-2 and Bax. ##p < .01 in comparison with controls, *p < .05, **p < .01 in comparison with model.
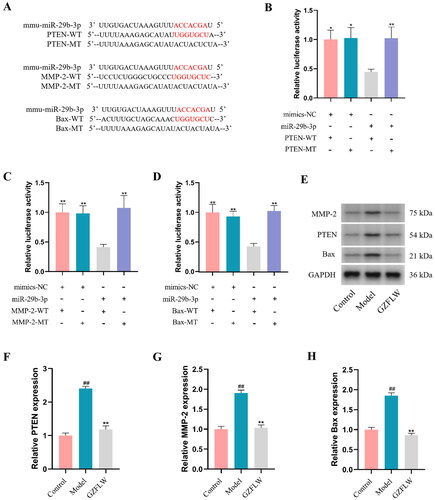
Figure 4. GZFLW regulates H19/miR-29-3p to inhibit autophagy. (A) Fluorescence image of autophagy vesicles after MDC staining. (B) The number of autophagy vesicles. (C and D) The number of autophagosomes and autophagy polymers. (E) Fluorescent images of autophagosomes (green) and autophagy polymers (red). #p < .05, ##p < .01 in comparison with controls, **p < .01 in comparison with model, &p < .05 in comparison with GZFLW.
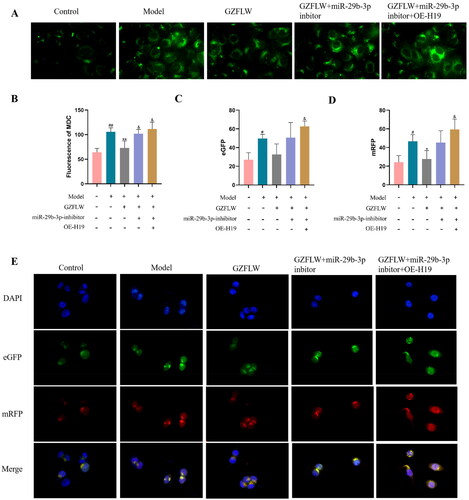
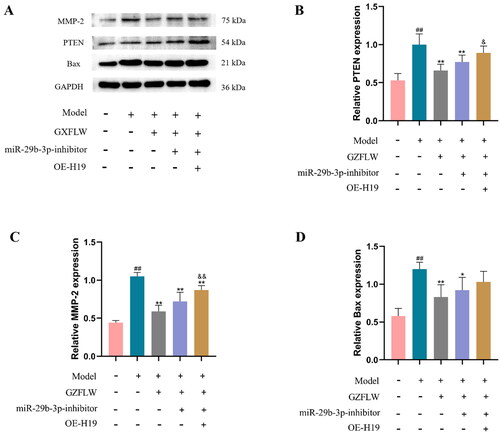
Figure 5. GZFLW affected the activity of the H19/miR-29b-3p signaling pathways. (A–D) Western blot analysis of PTEN, MMP-2 and Bax proteins transfected with miR-29b-3p or expression of H19. ##p < .01 in comparison with controls, *p < .05 and **p < .01 in comparison with model, &p < .05 and &&p < .01 in comparison with GZFLW.