
Figures & data
Table 1. Characteristics of studied patients: PCOS and controls.
Figure 1. Comparison of visfatin (A) and apelin (B) levels between IR and non-IR PCOS patients. Visfatin predicts ROC curve of IR in adolescent PCOS patients (C). *p < 0.05.
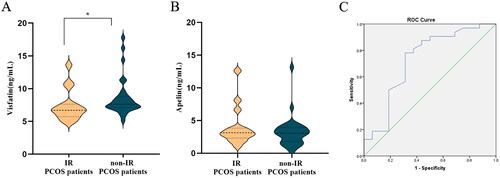
Table 2. Relationship between visfatin and apelin levels and indices of glucose and lipid metabolism.