
Figures & data
Figure 1. Flowchart of participants included in analyses.
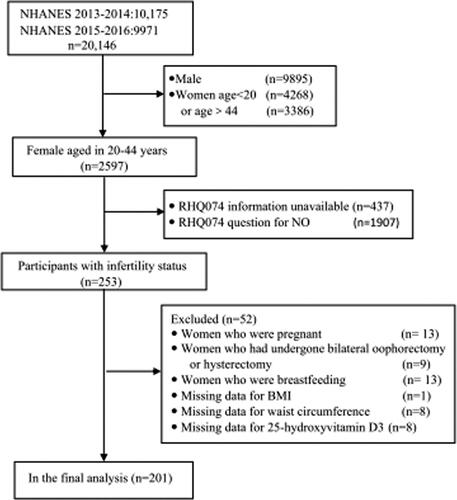
Table 1. Descriptions of study individuals’ characteristics.
Table 2. Linear regression analysis between vitamin D and study variables.
Figure 2. Multivariable-adjusted spline curves for serum vitamin D levels about obesity (a) and abdominal obesity (b) as assessed by a spline regression model. (Solid lines—OR, dashed lines—95% CI) The model was adjusted for age (20–30, 31–40 and >40 years), race (Mexican American, Non-Hispanic white, Non-Hispanic Black and other race), education level (below high school and high school or above), and poverty income ratios (poor and not poor). P Nonlinear > 0.05 implies a significant linear relationship.
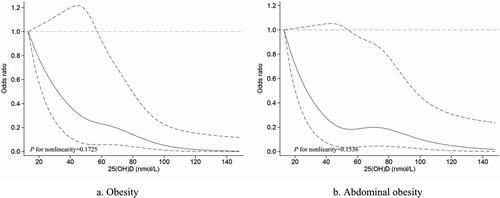
Table 3. Association between serum vitamin D quartiles and obesity/abdominal obesity.