
Figures & data
Table 1. Comparison of baseline characteristics between the two groups.
Table 2. Comparison of controlled ovarian hyper stimulation and embryologic outcomes.
Figure 1. Distribution of reproductive outcomes of PPOS protocol group and GnRH-a long group: (A) No. of oocytes retrieved; (B) 2PN fertilization rate; (C) High-quality embryo; (D) Clinical pregnancy rate; (E) Early abortion rate; (F) Severe OHSS rate.
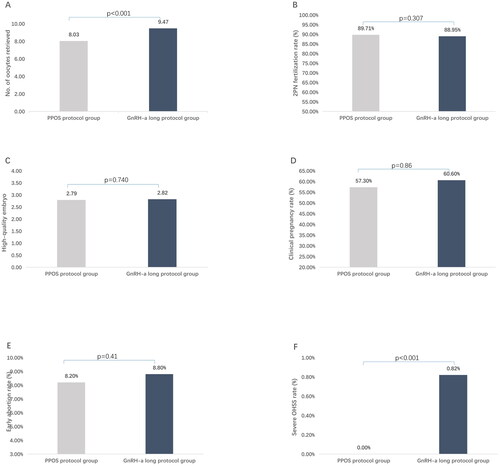
Table 3. Comparison of clinical outcomes (per embryo transfer cycle).