
Figures & data
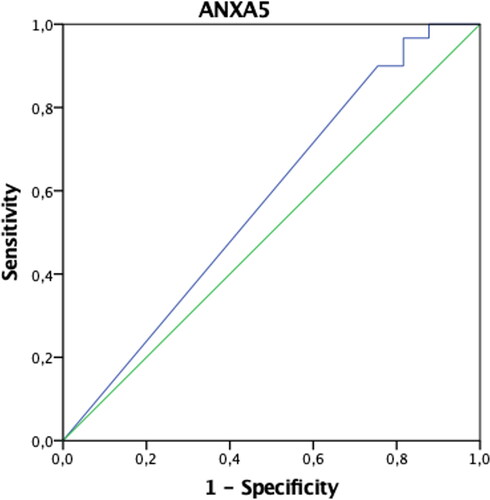
Graph 1. ROC curve of ANXA5 values in differentiating patients with endometriosis.
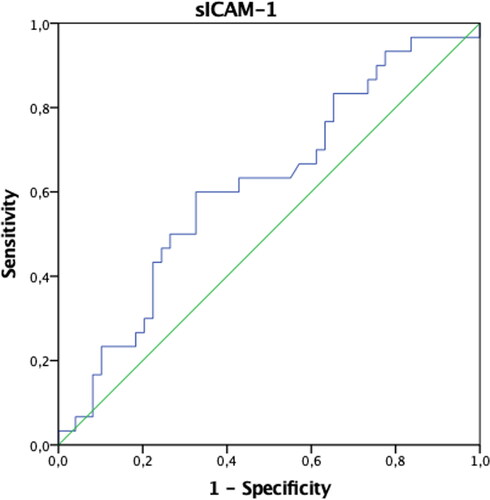
Graph 2. ROC curve of sICAM-1 values in differentiating patients with endometriosis.
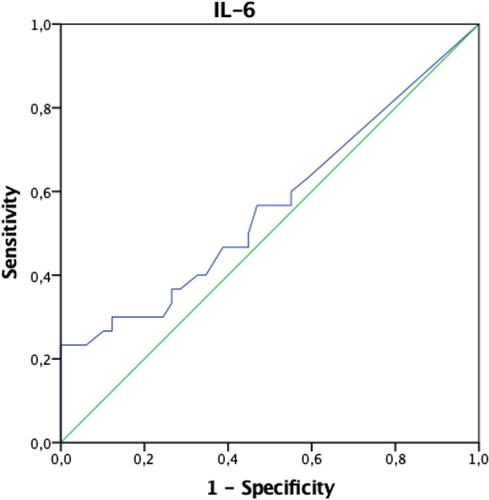
Graph 3. ROC curve of IL-6 values in differentiating patients with endometriosis.
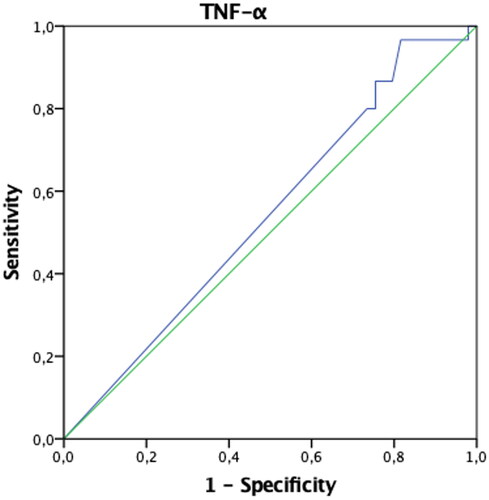
Graph 4. ROC curve of TNF- α values in differentiating endometriosis patients.
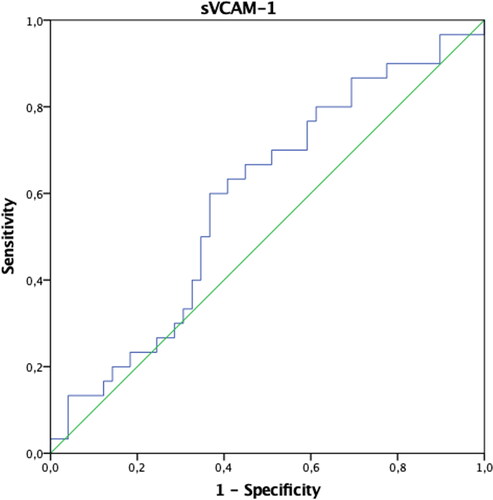
Graph 5. ROC curve of sVCAM-1 values in differentiating patients with endometriosis.
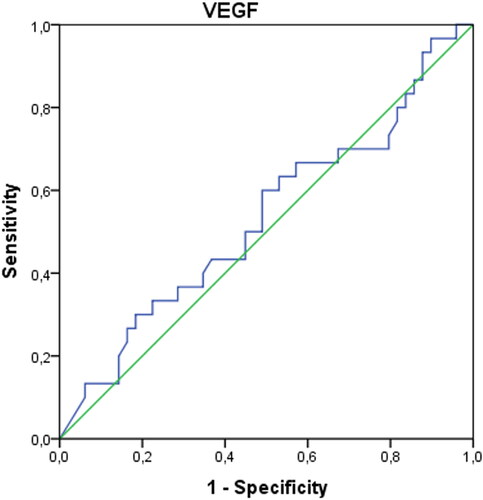
Graph 6. ROC curve of VEGF values in differentiating patients with endometriosis.
Graph 7. ROC curve of Ca 125 values in differentiating endometriosis patients.
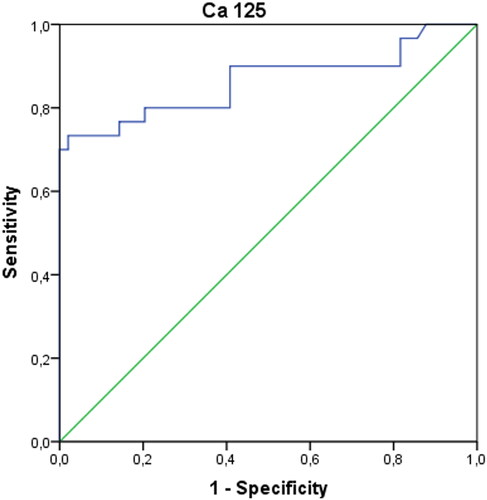
Table 1. Comparison of preoperative and postoperative biomarker values of patients in the endometriosis group (n = 30) and control group (n = 49).
Table 2. ROC curves and diagnostic performance of biomarker values in distinguishing patients with endometriosis.
Table 3. Diagnostic performance of biomarker combinations in differentiating patients with endometriosis.