
Figures & data
Table 1. Primer sequences used in this study.
Figure 1. CNQP promotes KGN cell apoptosis and autophagy. KGN cells were cultured with CNQP-containing serum: CCK-8 (A) and EdU (B) were used to detect cell proliferation; (C) flow cytometry to detect cell apoptosis; (D) western blotting to detect autophagy-related protein expression; (E) BATMAN website to predict target genes of the main components of CNQP; and RT-qPCR (F) and western blotting (G) to detect GATA3 mRNA and protein expression. N = 3; **p < .01, compared to the control group.
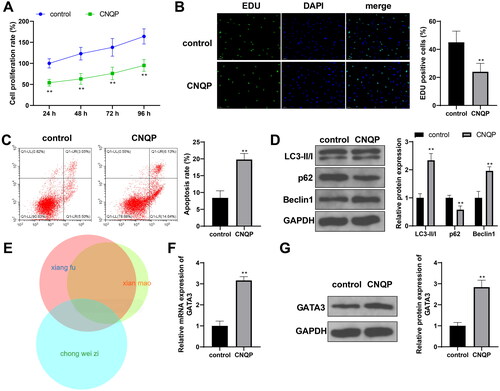
Figure 2. Inhibition of GATA3 eliminates the inhibitory effects of CNQP on KGN cells. RT-qPCR (A) and western blotting (B) were used to detect GATA3 mRNA and protein expression in KGN cells transfected with sh-NC or sh-GATA3. Next, transfected KGN cells were cultured with CNQP-containing serum: CCK-8 (C) and EdU (D) were used to detect cell proliferation; (E) flow cytometry to detect cell apoptosis; and (F) western blotting to detect autophagy-related protein expression. N = 3; *p < .05 and **p < .01, compared to the control group; #p < .05 and ##p < .01, compared to the CNQP + sh-NC group.
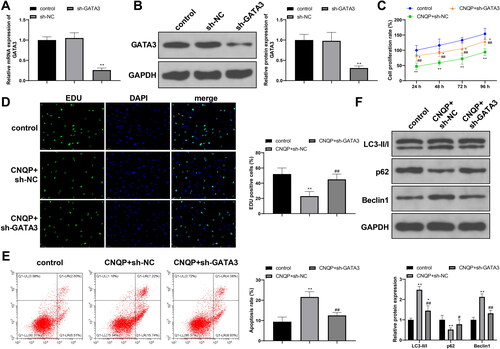
Figure 3. GATA3 promotes transcriptional expression of MYCT1. (A) Bioinformatics analysis of differentially expressed genes in PCOS. RT-qPCR (B) and western blotting (C) detection of MYCT1 mRNA and protein expression in KGN cells. (D) The binding sites for GATA3 in the MYCT1 promoter. (E) The binding motif of GATA3. (F) ChIP detection of the binding of GATA3 and the MYCT1 promoter. (G) Luciferase reporter vectors containing MYCT1 promoter fragments. (H) Dual-luciferase reporter assay detection of GATA3’s regulation of MYCT1 promoter activity. N = 3; *p < .05 and **p < .01, compared to the control, IgG, or sh-NC group; ##p < .01, compared to the CNQP + sh-NC group.
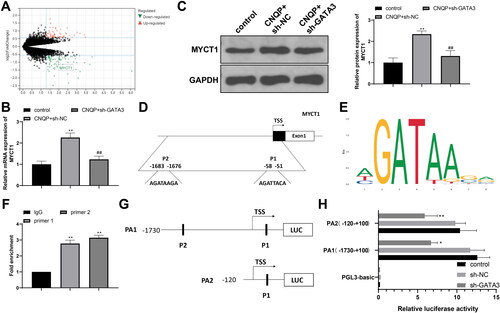
Figure 4. MYCT1 drives KGN cell apoptosis and autophagy. KGN cells were transfected with sh-NC, sh-MYCT1, OE-NC, or OE-MYCT1: RT-qPCR (A) and western blotting (B) were used to detect MYCT1 mRNA and protein expression; (C) CCK-8 to detect cell proliferation (**p < .01, compared to the OE-NC group; ##p < .01, compared to the sh-NC group); (D) EdU to detect cell proliferation; (E) flow cytometry to detect cell apoptosis; and (F) western blotting to detect autophagy-related protein expression. N = 3; *p < .05, **p < .01.

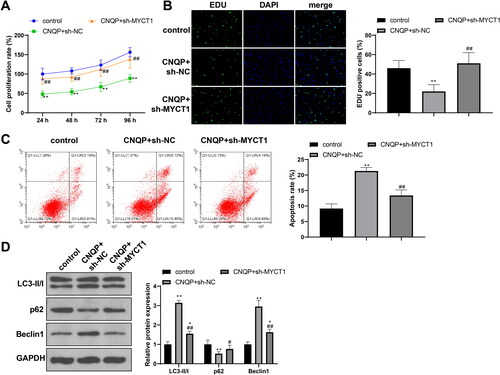
Figure 5. CNQP stimulates KGN cell apoptosis and autophagy via GATA3/MYCT1. KGN cells were transfected with sh-NC or sh-MYCT1 and cultured with CNQP-containing serum: CCK-8 (A) and EdU (B) were used to detect cell proliferation; (C) flow cytometry to detect cell apoptosis; and (D) western blotting to detect autophagy-related protein expression. N = 3; **p < .01, compared to the control group; #p < .05 and ##p < .01, compared to the CNQP + sh-NC group.
Availability of data and materials
The datasets used or analyzed during the current study are available from the corresponding author on reasonable request.