
Figures & data
Figure 1. Flowchart of the retrospective cohort study. Note: SBT = single blastocyst transfer; GS = gestational sac; FHB = fetal heartbeat; No. = number of.; IVF = in vitro fertilization; ICSI = intracytoplasmic sperm injection; ET = embryo transfer; PGD = preimplantation genetic diagnosis.
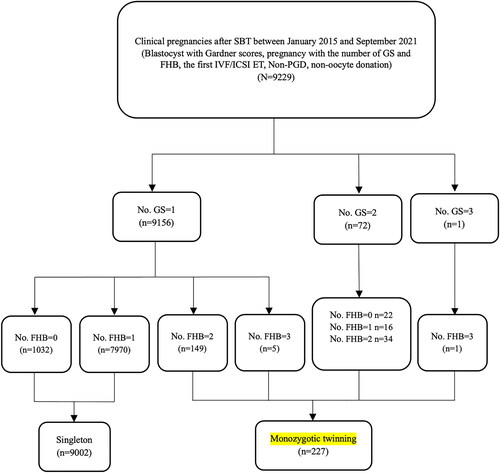
Table 1. Demographic characteristics of patients and embryos in the MZT and singleton cohorts of single blastocyst transfer cycles.
Figure 2. Key factors affecting the frequency of MZT. ‘aOR’ indicates that the odds ratio (or) and 95% CI were adjusted for potential confounding factors. Note: MZT = monozygotic twinning; ICM = inner cell mass; TE = trophectoderm; AH = assisted hatching.
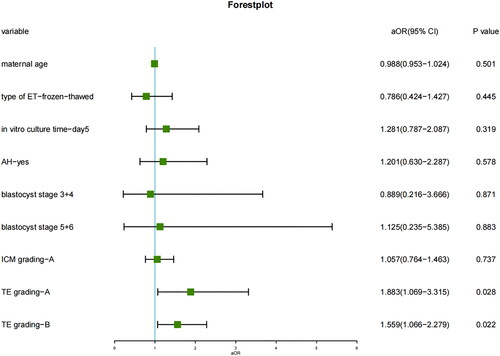
Figure 3. MZT rate of different ICM and TE grading of blastocysts based on the Gardner scoring system. Note: ICM = inner cell mass; TE = trophectoderm; MZT = monozygotic twinning.
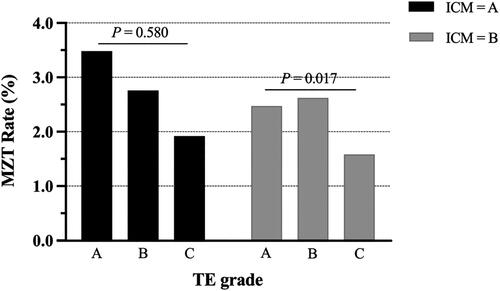
Table 2. Multivariate analysis of the blastocyst morphology parameters on MZT.