
Figures & data
Table 1. Primer sequences.
Figure 1. Establishment of polycystic ovary syndrome mouse model. A mouse model of PCOS was constructed with DHEA. (A) Serum levels of LH, T, FSH, AMH, and E2 were examined with ELISA. (B) Pathological changes of mice ovarian tissues were estimated using hematoxylin–eosin (HE) staining (×200). The follicles (F) and corpus luteum (CL) are shown on the control group ovarian micrographs. ***p < .001 vs. control.
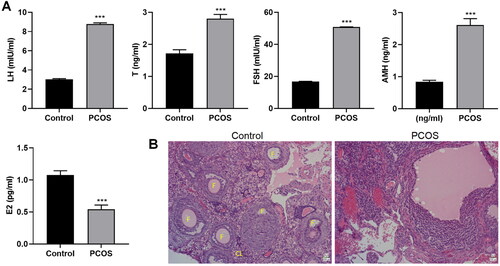
Figure 2. Protocatechuic acid influences PCOS mice. Following PCOS mouse model was constructed, 10, 20, and 40 mg/kg protocatechuic acid were intraperitoneally injected into PCOS mice. (A) Analysis of LH, T, FSH, AMH, and E2 levels by ELISA. (B) Comparison of pathological changes of mice ovarian tissues with HE staining (×200). The follicles (F) and corpus luteum (CL) are shown on the control group ovarian micrographs. ***p < .001 vs. control; #p < .05; ###p < .001 vs. PCOS.
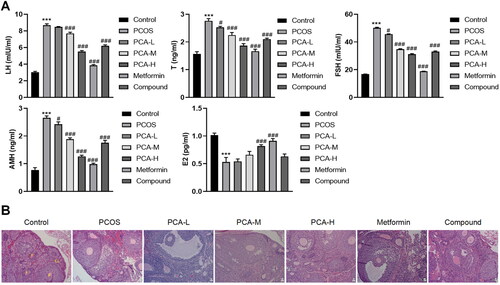
Figure 3. Analysis of the toxic effect of protocatechuic acid on mice. (A) Detection of body weight of mice. (B) Aspartate transaminase (AST), alanine aminotransferase (ALT), alkaline phosphatase (ALP), white blood cell count (WBC), red blood cell count (RBC), and platelets (PLT) contents were checked with Automated Hematology Analyzer. (C) Pathological changes in the heart, liver, spleen, lung, and kidney in mice were appraised using HE staining (×200).
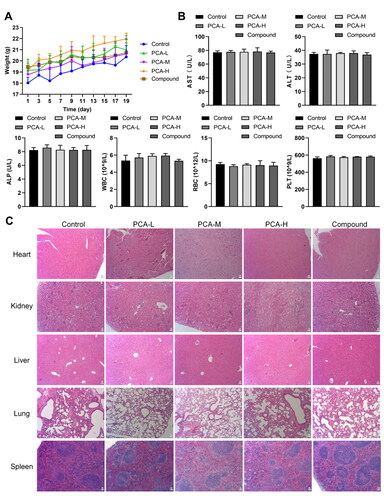
Figure 4. Protocatechuic acid impacts ROS, autophagy, and apoptosis of PCOS ovarian granulosa cells. Ovarian granulosa cells were isolated from PCOS and control mice. (A) ROS levels were tested by immunofluorescence assay. (B) Detection of LC3 levels using immunofluorescence analysis. (C) Apoptosis of PCOS ovarian granulosa cells was examined with flow cytometry. (D) MRNA levels of PI3K p85, AKT, and mTOR were checked with quantitative real-time PCR (qRT-PCR). E: Comparison of protein levels of PI3K p85, AKT, and mTOR using Western blot. ***p < .001 vs. control; ##p < .01; ###p < .001 vs. PCOS.
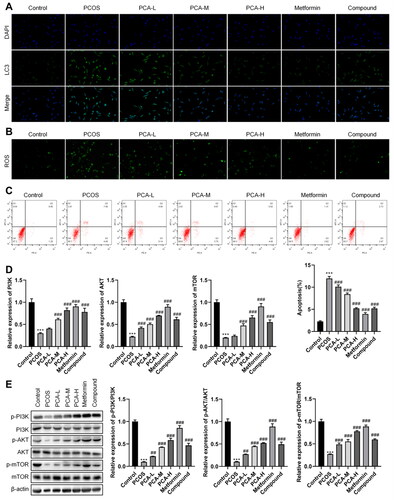
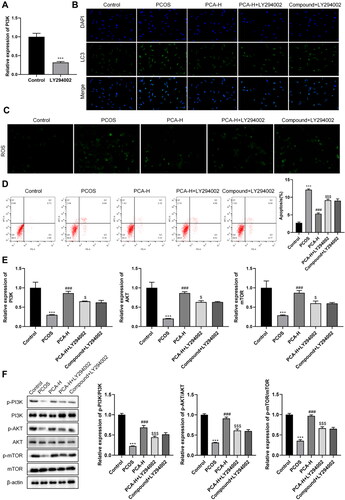
Figure 5. PI3K/AKT/mTOR axis mediates PCOS ovarian granulosa cells. PCOS ovarian granulosa cells were exposed to 25 µmol/L LY294002 for 1.5 h. (A and B) Comparison of ROS levels with immunofluorescence analysis. (C) LC3 levels were examined using an immunofluorescence assay. (D) Analysis of PCOS ovarian granulosa cell apoptosis with flow cytometry. (E and F) MRNA and protein levels of PI3K p85, AKT, and mTOR were tested by qRT-PCR and Western blot. ***p < .001 vs. control; ###p < .001 vs. PCOS; $p < .05; $$$p < .001 vs. PCA-H.
Data availability statement
The data that support the findings of this study are available from the corresponding author upon reasonable request.