
Figures & data
Table 1. Baseline characteristics of patients in two groups.
Figure 1. Expression and localization of Talin1 and GLUT4 in endometrium of PCOS-IR and control patients. (A) Localization of Talin1 and GLUT4 in the endometrium; (B, C) mRNA and protein levels of Talin1 and GLUT4 in endometrium of PCOS-IR and control patients. **p < 0.01, ***p < 0.001.
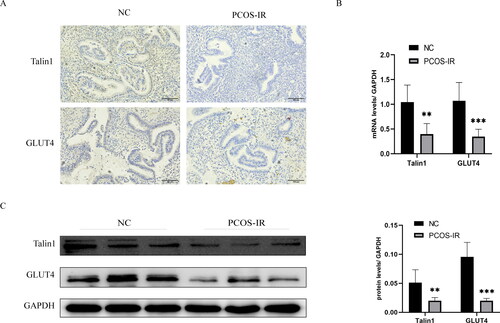
Figure 2. Effect of Talin1 on GLUT4 expression. (A, B) mRNA and protein levels were analyzed by RT-qPCR and western blot after overexpression and silencing of Talin1; (C) The interaction between Talin1 and GLUT4 proteins was examined by Co-IP. ***p < 0.001.
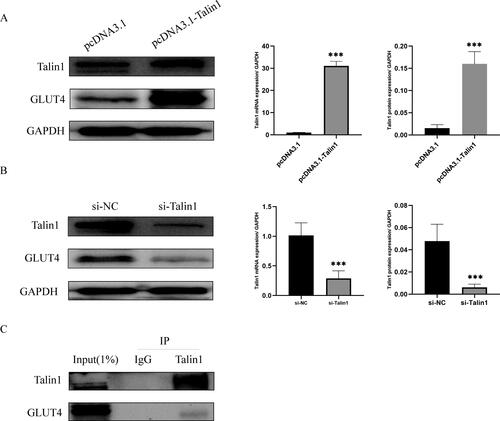
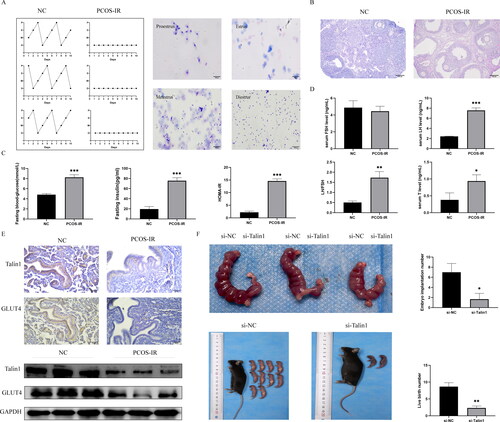
Figure 3. The role of Talin1 in endometrium of PCOS-IR was examined in vivo. (A) The estrus cycles in model and control mice; (B) ovarian changes in model and control mice; (C) Fasting blood glucose, fasting insulin, and HOMA-IR were measured in model and control mice; (D) FSH, LH, and T were measured in model and control mice; (E) Expression of Talin1 and GLUT4 in endometrium of PCOS-IR and control mice; (F) Effect of Talin1 on embryo implantation and live birth number in mice. *p < 0.05, **p < 0.01, ***p < 0.001.
Data availability statement
The data supporting the findings in this study are available from the corresponding author on reasonable request.