
Figures & data
Figure 1. R. chingii treatment alleviated the disruption of serum hormone levels in the PCOS model. (A) Vaginal exfoliated smear in rats. Scale, 200 μm in the PCOS model group, the exudated vaginal cells showed continuous keratinization in two estrous cycles (10 d). (B-E) Fasting plasma glucose (FGP) was measured by Biochemical Analyzer. Serum fasting insulin (FINS), luteinizing hormone (LH), testosterone (T), C-reactive protein (CRP), and sex hormone binding globulin (SHGB) levels were detected by ELISA. Homeostasis model assessment of insulin resistance (HOMA-IR) = FPG × FINS/22.5, free androgen index (FAI) = T/SHBG × 100. (F) Morphological changes of ovary tissue (H&E, × 100 and × 400). *p < 0.05 vs. control, **p < 0.01 vs. control, ##p < 0.01 vs. PCOS.
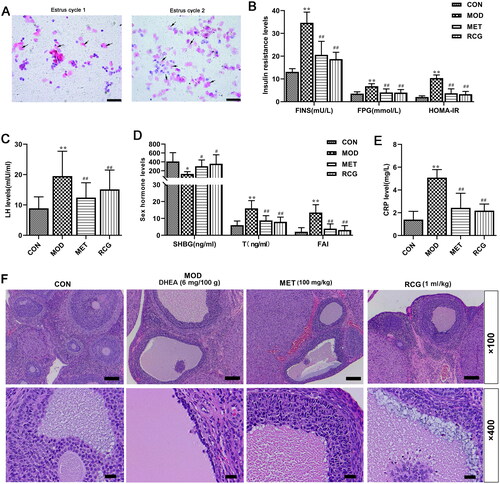
Table 1. Primer sequences for RT-qPCR.
Figure 2. R. chingii treatment attenuated cell apoptosis and IR in the ovary of PCOS rats. (A-C) P-caspase-1, C-caspase-1 and IRS-1 RNA levels were examined using RT-qPCR. (B-E) P-caspase-1, C-caspase-1 and IRS-1 protein levels were analyzed using western blot. β-actin is a loading control. **p < 0.01 vs. control, #p < 0.05 vs. PCOS, ##p < 0.01 vs. PCOS.
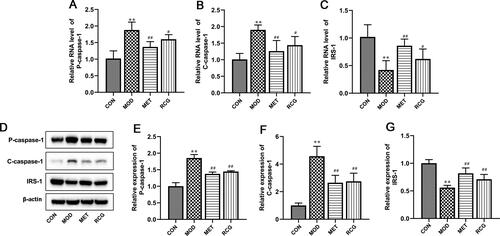
Figure 3. R. chingii treatment inhibited gene expression of TXNIP/NLRP3 pathway in the ovary of PCOS rats. (A-C) TXNIP, NLRP3, and ASC RNA levels were examined using RT-qPCR. (B-E) TXNIP, NLRP3, and ASC protein levels were examined by western blot. β-actin is a loading control. **p < 0.01 vs. control, #p < 0.05 vs. PCOS, ##p < 0.01 vs. PCOS.
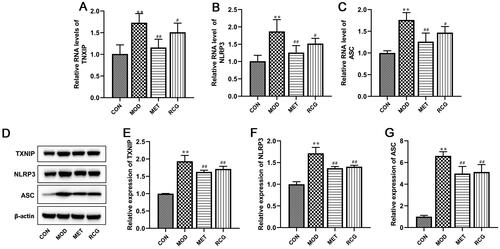
Figure 4. R. chingii treatment suppressed cell apoptosis and IR via deactivating TXNIP/NLRP3 pathway. PCOS rats were co-treated with R. chingii followed by injecting with AD-TXNIP adenovirus which was stably overexpressed TXNIP through the tail vein. TXNIP, NLRP3, ASC, P-caspase-1, C-caspase-1, and IRS-1 protein levels were examined by western blot. β-actin is a loading control. **p < 0.01 vs. control, #p < 0.05 vs. PCOS, ##p < 0.01 vs. PCOS, &p < 0.05 vs. R. chingii treatment.
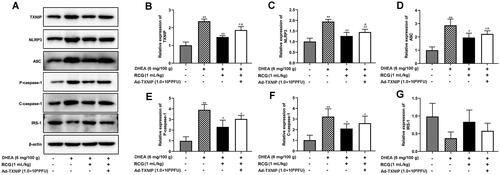
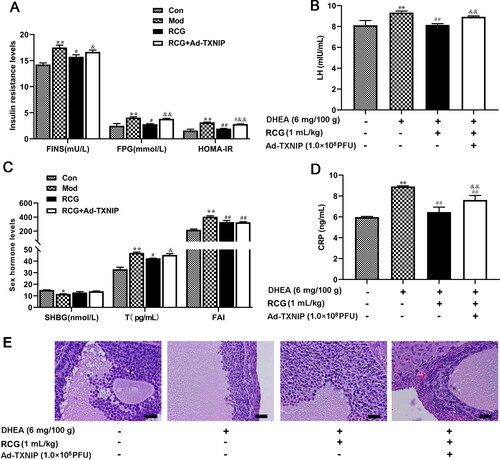
Figure 5. R. chingii treatment restored the ovary disorder through TXNIP/NLRP3 pathway. PCOS rats were co-treated with R. chingii followed by injecting with AD-TXNIP adenovirus which was stably overexpressed TXNIP through the tail vein. (A-D) FPG was measured by Biochemical Analyzer. FINS, LH, T, CRP, and SHGB levels were detected by ELISA. HOMA-IR = FPG × FINS/22.5, FAI = T/SHBG × 100. (F) Morphological changes of ovary tissue (H&E, × 400). **p < 0.05 vs. control, **p < 0.01 vs. control, #p < 0.05 vs. PCOS, ##p < 0.01 vs. PCOS, &p < 0.05 vs. R. chingii treatment, &&p < 0.01 vs. R. chingii treatment.
Data availability statement
The datasets used or analyzed during the current study are available from the corresponding author upon reasonable request.