
Figures & data
Figure 1. Determination of the adenomyotic lesion. (a) The extent of the adenomyotic lesion prior to treatment is indicated by the red dotted line. (b) the extent of the adenomyotic lesion 16 weeks after treatment is indicated by the red dotted line. We quantified the uterine, fibroid, and adenomyotic lesion volumes both prior to and 16 weeks post-treatment utilizing the formula for the volume of an ellipsoid, as described in the Material and Methods section.
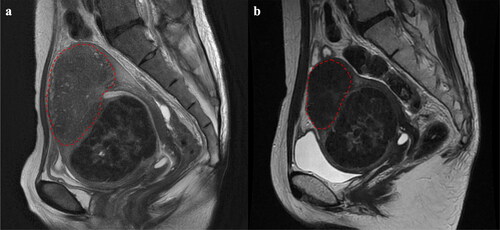
Table 1. Patient characteristics of a total of 56 women with adenomyosis and fibroids in Group A, and fibroids only in Group B.
Figure 2. Efficacy end points. (a) Percent change in uterine volume from baseline to week 16 (GroupA -43 ± 19.1% vs -27.7 ± 21.2%, p = .00972), (b) Percent change in the volume of the primary uterine fibroid from baseline to week 16 (GroupA -33 ± 29.0% vs -24.7 ± 27.4%, p = .297). Group a = adenomyosis and fibroids; GroupB = fibroids only.
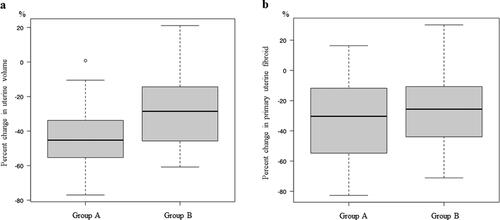
Figure 3. Percent change in adenomyosis and Myoma from baseline to week 16 when focusing on lesions regardless of group (adenomyosis -61 ± 14.4% vs fibroid -33 ± 29.0%, p < .001).
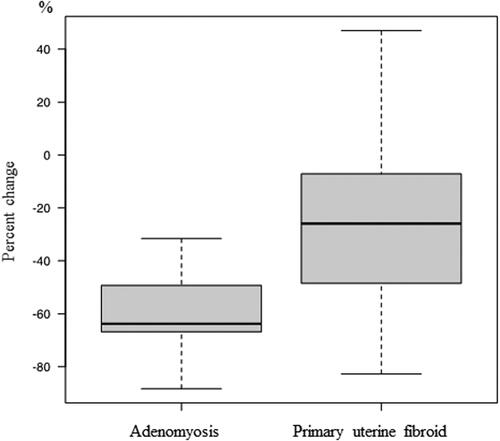
Table 2. Efficacy of treatment.
Data Availability statement
All data were obtained from Kobe University medical records.