
Figures & data
Figure 1. Flow chart of literature screening.
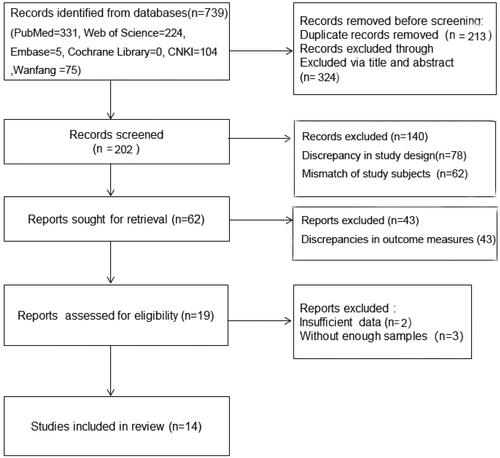
Figure 2. the Result of risk of bias.
A: Risk of bias graph; B: Risk of bias summary
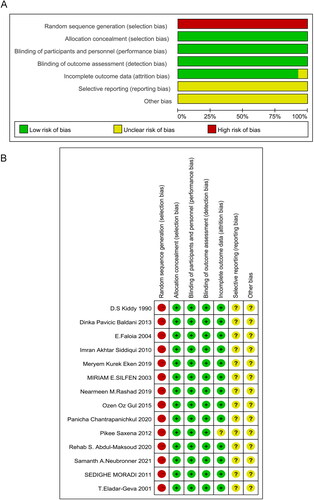
Table 1. Basic characteristics of included literature.
Figure 3. Forest plots for the Comparisons of clinical indicators between two groups of patients with PCOS (A: systolic blood pressure, SBP; B: diastolic blood pressure, DBP; C: glucose; D: sex hormone-binding globulin, SHBG).
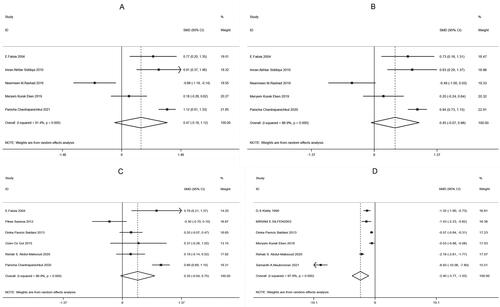
Figure 4. Sensitivity analysis of clinical indicators in two groups of patients with PCOS (A: systolic blood pressure, SBP; B: diastolic blood pressure, DBP; C: glucose; D: sex hormone-binding globulin, SHBG).
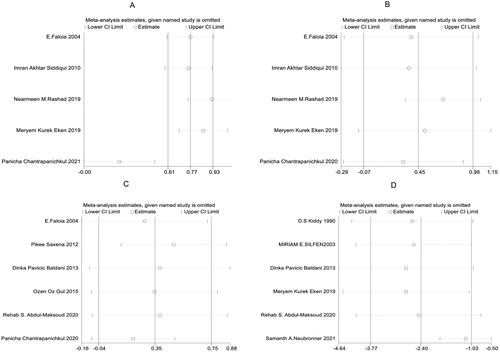
Figure 5. Funnel plots of clinical indicators in two groups of patients with PCOS (A: systolic blood pressure, SBP; B: diastolic blood pressure, DBP; C: glucose; D: sex hormone-binding globulin, SHBG).
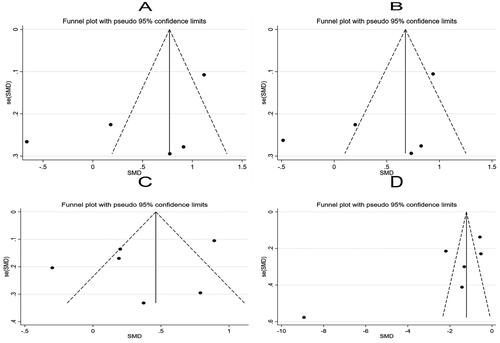
Figure 6. Forest plots for the comparison of blood lipid parameters between two groups of patients with PCOS (A: total cholesterol, TC; B: triglyceride, TG; C: low-density lipoprotein, LDL; D: high-density lipoprotein, HDL).
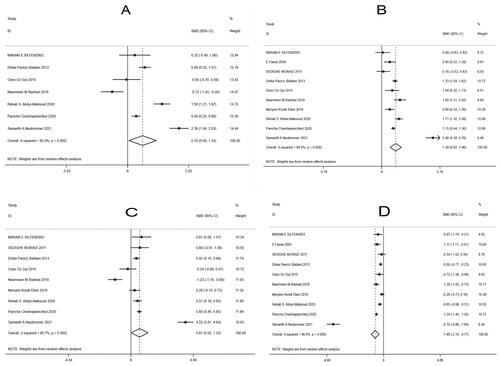
Figure 7. Sensitivity analysis of blood lipid parameters in two groups of patients with PCOS (A: total cholesterol, TC; B: triglyceride, TG; C: low-density lipoprotein, LDL; D: high-density lipoprotein, HDL).
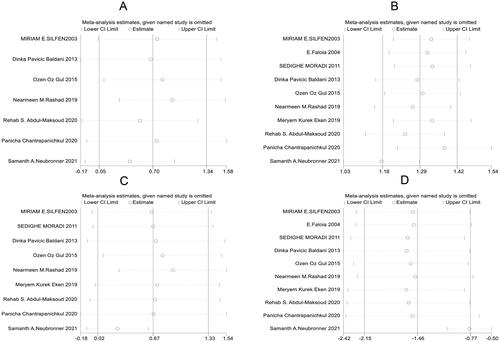
Figure 8. Funnel plots of blood lipid parameters in two groups of patients with PCOS (A: total cholesterol, TC; B: triglyceride, TG; C: low-density lipoprotein, LDL; D: high-density lipoprotein, HDL).
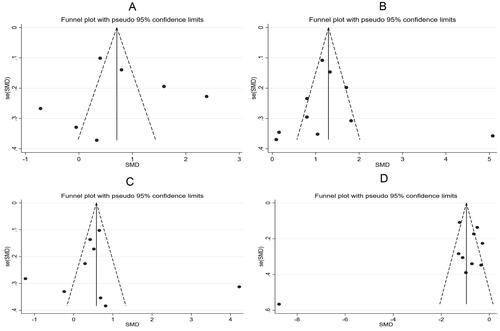
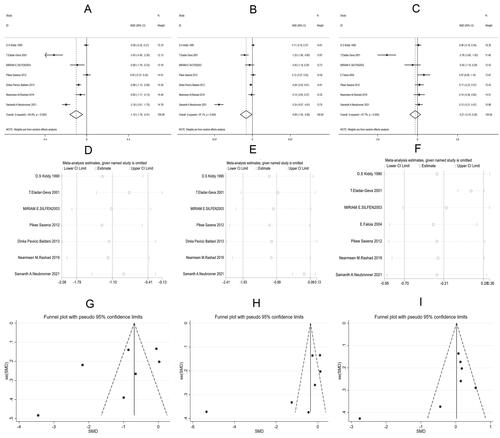
Figure 9. Meta-analysis of hormone indicators in two groups of patients with PCOS.
C: Forest plots of luteinizing hormone (LH, A), follicle stimulating hormone (FSH, B), testosterone (C); D-F: Sensitivity analysis of LH (D), FSH (E), testosterone (F); G-I: Funnel plots of LH (G), FSH (H), testosterone (I)
Supplemental Material
Download MS Word (12.1 KB)Availability of data and materials
The datasets used and/or analyzed during the current study are available from the corresponding author on reasonable request.