
Figures & data
Figure 1. Flow diagram of the study and analyzed groups.
GDM, gestational diabetes mellitus; DM, diabetes mellitus; NGT, normal glucose tolerance; OAV, one abnormal value; OGTT, oral glucose tolerance test; SMBG, self-measurement blood glucose.
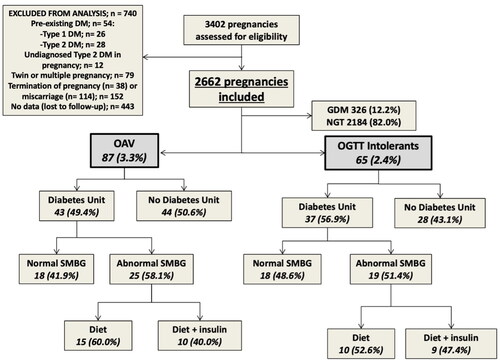
Table 1. Baseline characteristics and maternal-fetal outcomes in OGTT-intolerant pregnant women.
Table 2. Baseline characteristics and maternal-fetal outcomes for one abnormal value (OAV) pregnant women.