
Figures & data
Table 1. Primary antibody information.
Table 2. Secondary antibody information.
Figure 1. Expression of autophagy and ferroptosis proteins in clinical EMS patients. (A,B) Positive expression of the Beclin1, LC3, GPX4, p53, and autophagy associated proteins was tested by the IHC (magnification 200×, scale bar: 100 μm), and the representative image of each group as well as the chart was showed. n = 3 in each group. (C) Expression of p62 was evaluated by western blot assay, and GAPDH was used as the internal control. n = 3 in each group. #p < .05 and ##p < .01 vs. control group. EMS: endometriosis; GPX4: glutathione peroxidase 4; IHC: immunohistochemistry.
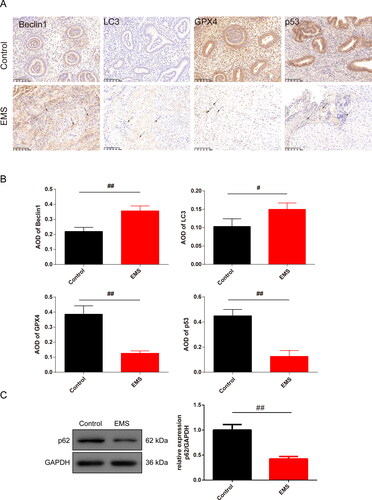
Figure 2. Pathology of EMS in rats and expression of the EMT related proteins in EMS cells. (A) HE staining was used to observe the pathology of the endometrium of the EMS rats (magnification, 40×, scale bar: 400 μm; 100×, scale bar: 200 μm). (B) Expression of the vimentin and E-cadherin was tested by IF to identify the cells that was cultured from the rats (magnification 200×, scale bar: 100 μm), and the chart was calculated. n = 3 in each group, ##p < .01 vs. control group. EMS: endometriosis; EMT: epithelial–mesenchymal transition; HE: hematoxylin and eosin; IF: immunofluorescence.
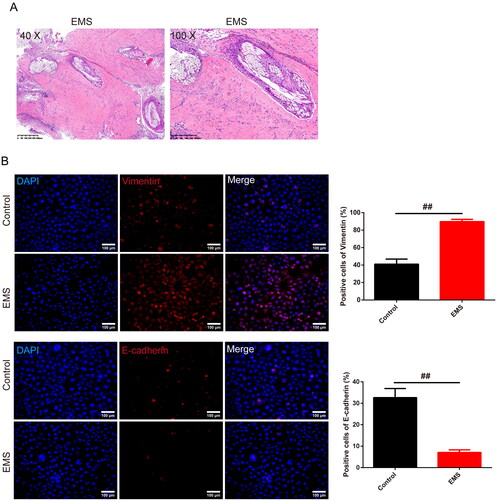
Figure 3. Ferroptosis is closely related to autophagy in EMS cells. (A) CCK8 was used to test the cell viability of each group of cells. n = 6 in each group. (B) Iron content of the cells was detected by the kit. n = 3 in each group. (C) ELISA kits were used to test the expression of the ROS and LPO of cells in each group. n = 3 in each group. (D) Transmission electron microscopy was used to observe the morphological changes of mitochondria (magnification 10.0k×, scale bar: 2 μm; magnification 25.0k×, scale bar: 500 nm) and the number of the mitochondria was recorded in the chart. n = 3 in each group. (E) Expression of NCOA4, FTH, FTMT, and HO-1 was evaluated by western blot assay, and GAPDH was used as the internal control. n = 3 in each group. #p < .05 and ##p < .01 vs. control group. @p < .05 and @@p < .01 vs. EMS group. $p < .05 and $$p < .01 vs. EMS + si-Atg5 group. EMS: endometriosis; CCK8: cell counting kit-8; HE: hematoxylin and eosin; ELISA: enzyme-linked immunosorbent assay; ROS: reactive oxygen species; LPO: lipid peroxide; NCOA4: Nuclear Receptor Coactivator 4; FTH: ferritin heavy chain; FTMT: ferritin mitochondrial; HO-1: heme oxygenase-1.
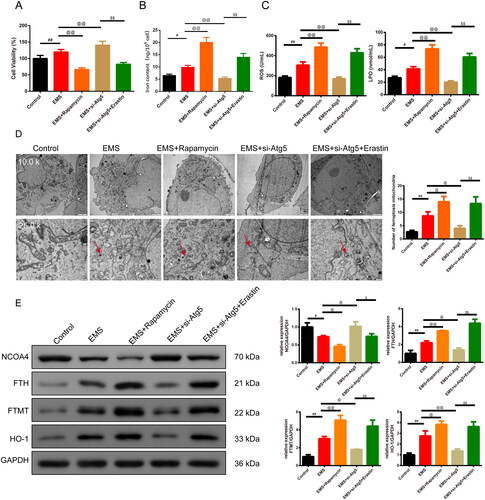
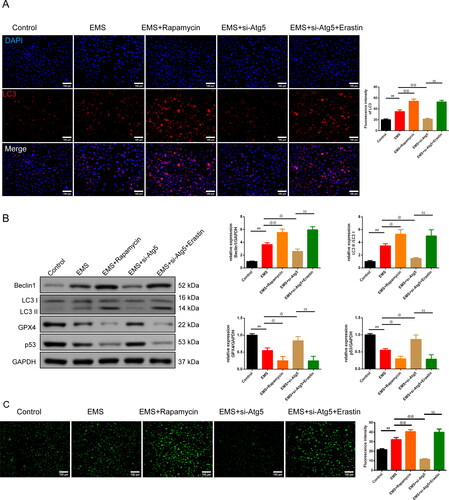
Figure 4. Autophagy-dependent ferroptosis is involved in EMS cells. (A) Expression of the LC3 in cells was tested by IF (magnification 200×, scale bar: 100 μm), and the chart was calculated. n = 3 in each group. (B) Expression of the Beclin1, LC3 II/LC3 I, GPX4, and p53 was tested by western blot. n = 3 in each group. (C) MDC staining was used to test the autophagy particle of cells in each group. n = 3 in each group. ##p < 0.01 vs. control group. @p < .05 and @@p < .01 vs. EMS group. $$p < .01 vs. EMS + si-Atg5 group. EMS: endometriosis; GPX4: glutathione peroxidase 4; IF: immunofluorescence; MDC staining: monodansylcadaverine staining.
Supplemental Material
Download TIFF Image (498.2 KB)Data availability statement
All data will be available upon request.