Figures & data
Table 1. Primer sequence for qRT-PCR.
Table 2. Antibody information of western blot.
Figure 1. FOXK1 is highly expressed in PCOS-derived GCs. (A) The morphology of rat ovarian GCs was observed. (Magnification, 40×, 100×, 200×). (B) qRT-PCR was used to detect FOXK1 mRNA level in GCs of PCOS rats. (C,D) Western blot was used to detect FOXK1 protein expression level in GCs of PCOS rats. n = 3, compared to the control group, ▲p < .05, ▲▲p < .01. Note. FOXK1: forkhead box K1; PCOS: polycystic ovarian syndrome; GCs: granulosa cells; qRT-PCR: quantitative real-time PCR.
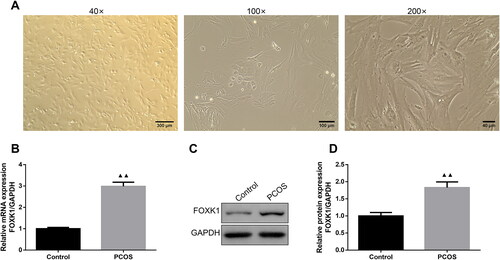
Figure 2. FOXK1 is successfully silenced or overexpressed and FOXK1 inhibits GCs proliferation in PCOS rats. (A) Transfection efficiency of FOXK1 silencing in GCs of PCOS rats was examined by qRT-PCR. (B) qRT-PCR was used to detect the transfection efficiency of FOXK1 overexpression in GCs of PCOS rats. (C) CCK-8 assay detected the effect of silencing FOXK1 on proliferation in GCs of PCOS rats. (D) CCK-8 assay was used to detect the effect of overexpression of FOXK1 on GCs proliferation in PCOS rats. n = 3, compared to the vector group, ▲p < .05, ▲▲p < .01.
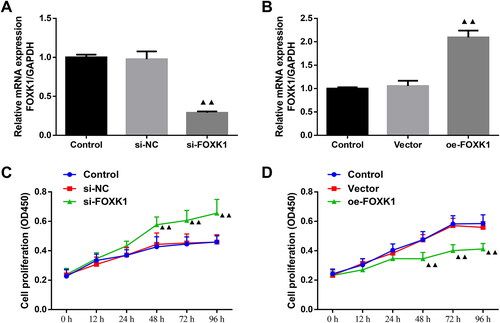
Figure 3. FOXK1 inhibits the DNA synthesis capacity of GCs in PCOS rats. (A,B) EDU staining was used to detect the effect of silencing FOXK1 on the ability of GCs DNA synthesis in PCOS rats. (C,D) EDU staining was used to detect the effect of overexpression of FOXK1 on the ability of GCs DNA synthesis in PCOS rats. Magnification, 200×. n = 3, compared to the vector group, ▲p < .05, ▲▲p < .01.
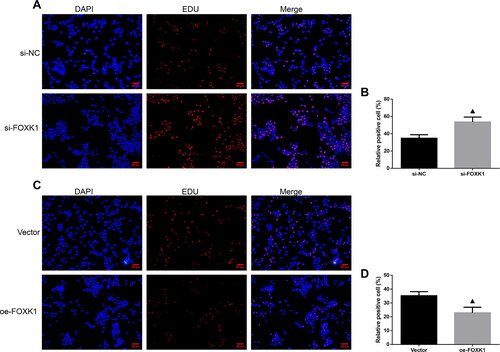
Figure 4. FOXK1 promotes apoptosis in GCs of PCOS rats. (A,B) Flow cytometry was used to detect the effect of silencing or overexpression of FOXK1 on GCs apoptosis in PCOS rats. (C–F) Effects of silencing or overexpression of FOXK1 on the apoptosis-related proteins Bax, cleaved caspase-3, and Bcl-2 expression levels in GCs were examined by western blot. n = 3, compared to the si-NC group, ▲p < .05; ▲▲p < .01; compared to the vector group, *p < .05, **p < .01. Note. Bcl-2: B-cell lymphoma-2; Bax: Bcl-2-Associated X.
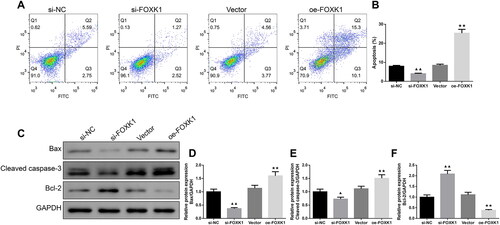
Figure 5. FOXK1 promotes GCs autophagy and AMPK/mTOR pathway protein levels in PCOS rats. (A,B) Immunofluorescence was used to examine the effect of silencing or overexpressing FOXK1 on the LC3 expression level in the GCs of PCOS rats. (Magnification, 200×). (C–H) Western blot was used to test the effect of silencing or overexpression of FOXK1 on autophagy and p-AMPK/AMPK, p-mTOR/mTOR protein expression levels in the GCs of PCOS rats. n = 3, compared to the si-NC group, ▲p < .05, ▲▲p < .01; compared to the vector group, *p < .05, **p < .01. Note. AMPK: AMP-activated protein kinase; mTOR: mammalian target of rapamycin.
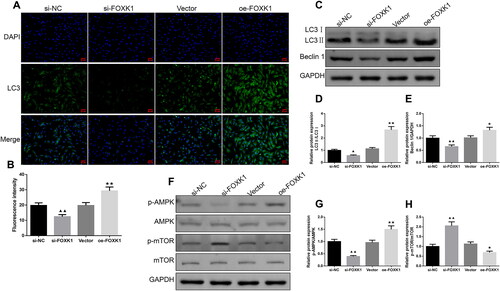
Figure 6. CFD reverses the effect of FOXK1 on GCs proliferation and apoptosis in PCOS rats. (A) qRT-PCR was used to examine the effect of CFD on the FOXK1 mRNA expression level in the GCs of PCOS rats. (B) CCK-8 was used to detect the effect of CFD on GCs proliferation in PCOS rats. (C,D) The effect of CFD on GCs apoptosis rate was detected by flow cytometry. (E,F) The effect of CFD on GCs apoptosis rate was measured by TUNEL staining (Magnification, 200×). (G–J) Western blot was used to detect the effect of CFD on the expression levels of apoptosis-related proteins Bax, cleaved caspase-3, and Bcl-2 in GCs of PCOS rats. n = 3, compared to the vector + 10%NRS group, ▲p < .05, ▲▲p < .01; compared to the Oe-FOXK1 + 10%NRS group, *p<.05, **p < .01. Note. NRS: normal rat serum.
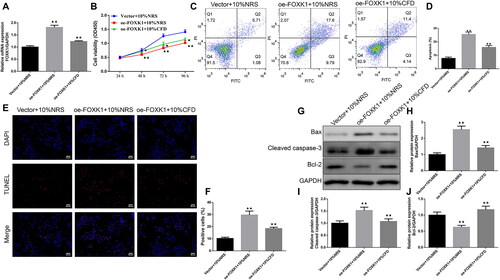
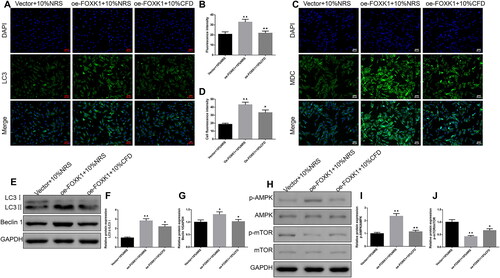
Figure 7. CFD reverses the effect of FOXK1 on the regulation of GCs autophagy and AMPK/mTOR pathway in PCOS rats. (A,B) The effect of CFD on the expression level of LC3 in GCs of PCOS rats was detected by immunofluorescence. Magnification, 200×. (C,D) The effect of CFD on autophagy in GCs of PCOS rats was detected by MDC staining. Magnification, 200×. (E–G) Western blot was used to detect the effects of CFD on the expression levels of LC3 II/I, Beclin 1, p-AMPK/AMPK and p-mTOR/mTOR proteins in GCs of PCOS rats. n = 3, compared to the vector + 10%NRS group, ▲p < .05, ▲▲p < .01; compared to the Oe-FOXK1 + 10%NRS group, *p < .05, **p < .01.