Figures & data
Figure 1. Study design and VCD treatment results.
A. Flow-chart visualization of the study group classification.
IP, intra-peritoneal; VCD, 4-vinylcyclohexene diepoxide with 160mg/kg; ND, normal diet; E2, estradiol with 0.2mg/kg; NT, no estradiol treatment; T1, treatment group 1 with delayed estradiol treatment for 3 weeks; T2, treatment group 2 with on-time, continuous estradiol treatment for 6 weeks; T3, treatment group 3 with on-time, short estradiol treatment for 3 weeks; PO, per oral; NS, normal saline 0.9%; HFD, high fat diet.
B. AMH and FSH levels after the completion of VCD treatment.
AMH, anti-Müllerian hormone; FSH, follicle-stimulating hormone; VCD, 4-vinylcyclohexene diepoxide. *P-value <.05 (vs. vehicle).
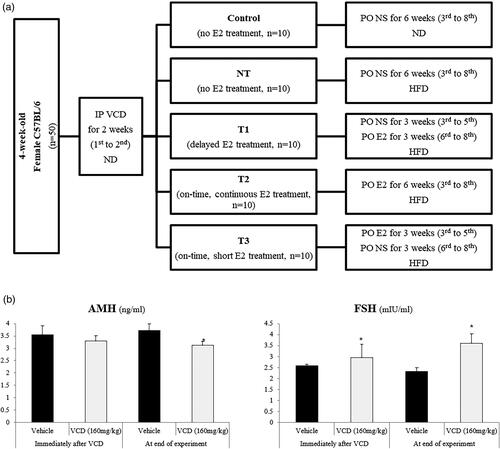
Table 1. Study design and group classification.
Figure 2. Effect of estradiol (E2) treatment on physiologic status of POI mice during the course of HT.
A. Body weight change pattern. B. Fasting blood glucose (FBG) level change pattern.
FBG, fasting blood glucose; Cont, control; NT, no estradiol treatment; T1, treatment group 1 with delayed estradiol treatment for 3 weeks; T2, treatment group 2 with on-time estradiol treatment for 6 weeks; T3, treatment group 3 with on-time estradiol treatment for 3 weeks. #P-value <0.001 (vs. NT); ##P-value <0.01(vs. NT).
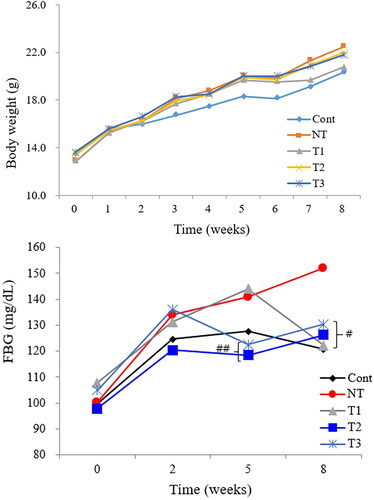
Figure 3. Effect of estradiol (E2) streatment on metabolic parameters in POI mice with different initiation time points and durations of HT.
A. Serum total cholesterol levels. B. Serum triglyceride levels. C. Serum insulin levels. D. Serum low-density lipoprotein-cholesterol levels.
Cont, control; NT, no estradiol treatment; T1, treatment group 1 with delayed estradiol treatment for 3 weeks; T2, treatment group 2 with on-time estradiol treatment for 6 weeks; T3, treatment group 3 with on-time estradiol treatment for 3 weeks; LDL-C, low-density lipoprotein-cholesterol. *P-value <0.001 (vs. Cont); **P-value <0.01 (vs. Cont); #P-value <0.001 (vs. NT); ##P-value <0.005 (vs. NT); †P-value <0.005 (vs T2); ‡P-value <0.001(vs T2).
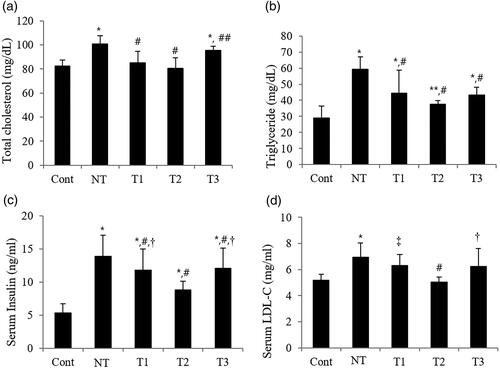
Figure 4. Effect of estradiol (E2) treatment on aortic thickness (μm) with different initiation time points and durations of HT.
A. Transverse section of descending thoracic aorta of the study subjects. B. Comparison of aorta thickness among the study groups.
Cont, control; NT, no estradiol treatment; T1, treatment group 1 with delayed estradiol treatment for 3 weeks; T2, treatment group 2 with on-time estradiol treatment for 6 weeks; T3, treatment group 3 with on-time estradiol treatment for 3 weeks. *P-value <0.001 (vs. Cont); #P-value <0.005 (vs. NT).
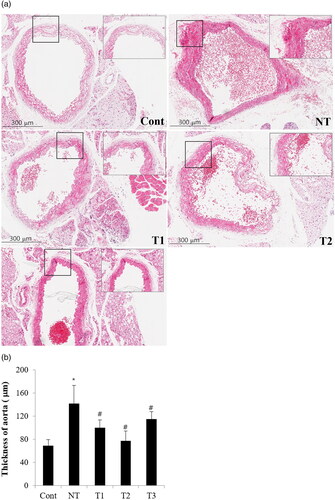
Figure 5. Effect of estradiol (E2) treatment on serum pro-inflammatory cytokines in POI mice with different initiation time points and durations of HT.
A. Serum TNF-α. B. Serum IL-1β.
TNF-α, tumor necrosis factor-α; IL-1β, Interleukin-1β;Cont, control; NT, no estradiol treatment; T1, treatment group 1 with delayed estradiol treatment for 3 weeks; T2, treatment group 2 with on-time estradiol treatment for 6 weeks; T3, treatment group 3 with on-time estradiol treatment for 3 weeks. *P-value <0.001 (vs. Cont); #P-value <0.001 (vs. NT); ##P-value <0.005 (vs. NT).
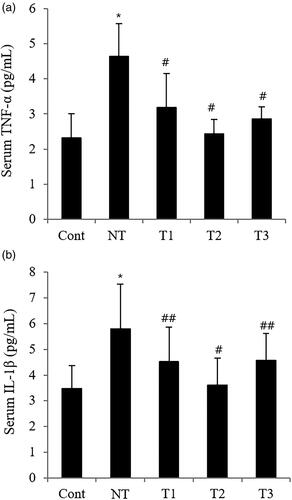
Table 2. Effect of estradiol (E2) treatment on organ weights in grams (g) of POI mice with different initiation time points and durations of HT.
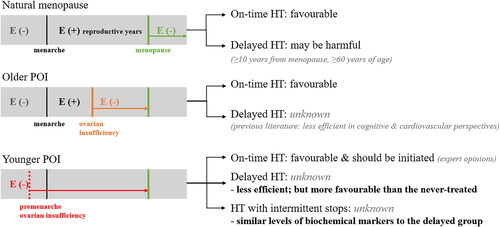
Figure 6. Summary of the findings and evidence-based interpretations of HT in POI.
E, estrogen; HT, hormone therapy.