
Figures & data
Figure 1. The consort flow chart.
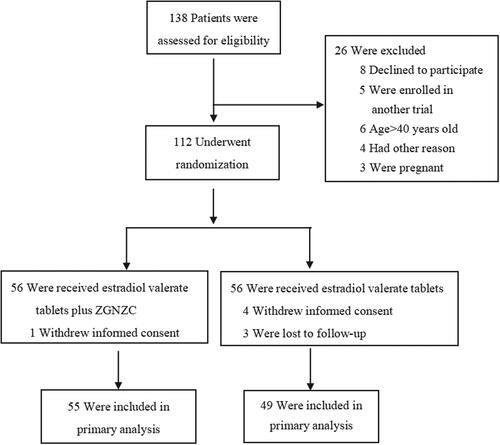
Table 1. Basic characteristics of the two groups.
Table 2. Between-group comparison of the experimental vs. control group.
Figure 2. Within-group comparison of EMT (A) and percentage of type A endometrium (B) before vs. after study for the experimental group.
*Represents p < .05. EMT = endometrium thickness.
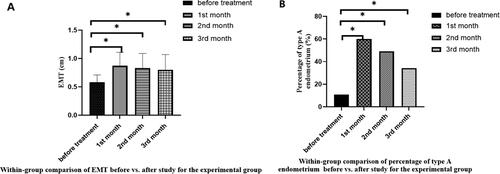
Table 3. Univariate analysis of pregnancy-related factors.
Data availability statement
The data that support the findings of this study are available from the corresponding author (RXY), upon reasonable request.