
Figures & data
Figure 1. SIRT6 in POF pathology and hormone (A) The levels of E2, FSH, LH, AMH, and progesterone in the serum of mice were detected using ELISA. (B) The pathological changes of ovarian tissue were evaluated by H&E staining and the number of follicles was counted. (C) RT-qPCR and (D) Western blotting were used to detect the enrichment of SIRT6 in ovarian tissue. (E) Mice were administrated the SIRT6 agonist MDL-800, RT-qPCR and (F) Western blotting was used to detect the enrichment of SIRT6 in ovarian tissue. (G) The effect of MDL-800 on the pathological changes of ovarian tissue was evaluated by H&E staining, and the number of follicles was counted. (H) The effect of MDL-800 on the levels of E2, FSH, LH, AMH, and progesterone in the serum of mice was detected using ELISA. Scale bar = 100 μm. ***P < 0.001.
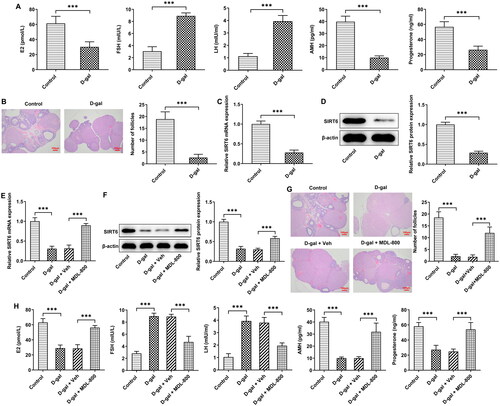
Figure 2. SIRT6 in POF oxidative stress and apoptosis (A) Oxidative stress in ovarian tissue was assessed by ROS staining and (B) SOD and MDA levels. (C) Apoptosis in ovarian tissue was identified by TUNEL staining. (D) The levels of apoptosis-related proteins in ovarian tissue were evaluated by western blotting. (E) The level of cleaved caspase 3 in ovarian tissue was evaluated by immunohistochemistry. Scale bar = 50 μm. **P < 0.01, ***P < 0.001.
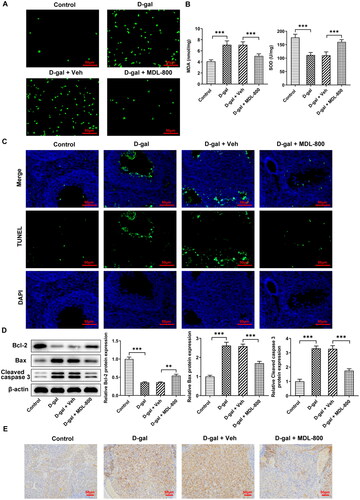
Figure 3. Oxidative stress and apoptosis in granulosa cells (A) Granulosa cells were stimulated by H2O2, the viability was assessed using a CCK8 assay. (B) The effect of H2O2 on the levels of ROS was assessed using a DCFH-DA probe. (C) The effect of H2O2 on the levels of SIRT6 was assessed using western blotting. (D) The effect of MDL-800 on viability was assessed using a CCK8 assay. (E) The effect of H2O2 and MDL-800 on the generation of ROS was assessed using a DCFH-DA probe. (F) The effect of H2O2 and MDL-800 on the levels of SOD and MDA was assessed using commercial kits. (G) The effect of H2O2 and MDL-800 on apoptosis was assessed using flow cytometry and (H) western blotting. Scale bar = 50 μm. *P < 0.05, **P < 0.01, ***P < 0.001.
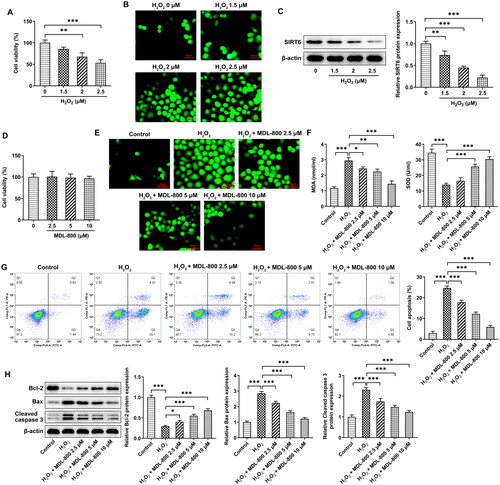
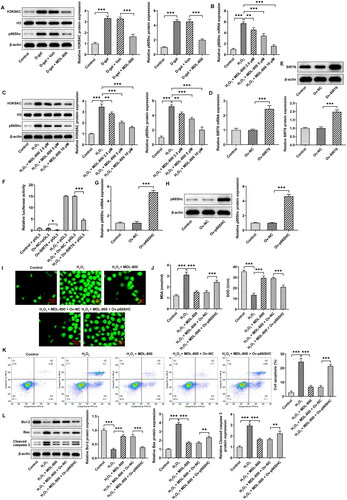
Figure 4. H3K9AC/p66Shc in granulosa cells (A) The levels of H3K9AC and p66Shc in ovarian tissues were determined using western blotting. (B) p66Shc mRNA levels in granulosa cells were determined using RT-qPCR. (C) H3K9AC and p66Shc protein levels in granulosa cells were determined using western blotting. (D) The transfection efficiency of SIRT6 overexpression was verified using RT-qPCR and (E) Western blotting. (F) Luciferase assay was used to evaluate the activity of the p66Shc promoter region. (G) The transfection efficiency of p66Shc overexpression was verified using RT-qPCR and (H) western blotting. (I) The effect of p66Shc overexpression on ROS generation was assessed using a DCFH-DA probe. (J) The effect of p66Shc overexpression on MDA and SOD levels was assessed using commercial kits. (K) The effect of p66Shc overexpression on apoptosis was assessed using flow cytometry and (L) western blotting. Scale bar = 50 μm. **P < 0.01, ***P < 0.001.
Data availability statement
All data generated or analyzed during this study are included in this article. Further inquiries can be directed to the corresponding author.