
Figures & data
Figure 1. Flowchart maternity data 2010–2017.
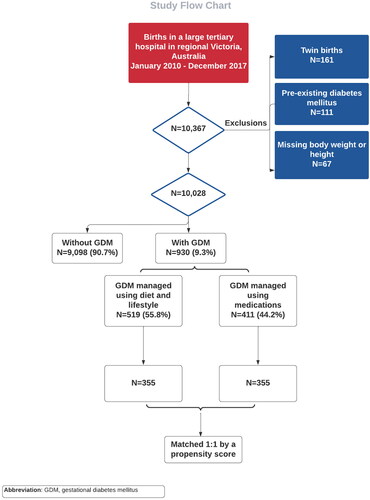
Table 1. Maternal characteristics by variables accounted for in the propensity score: before and after matching.
Figure 2. Standardized differences before and after propensity score matching by study variables included in the construction of the propensity score.
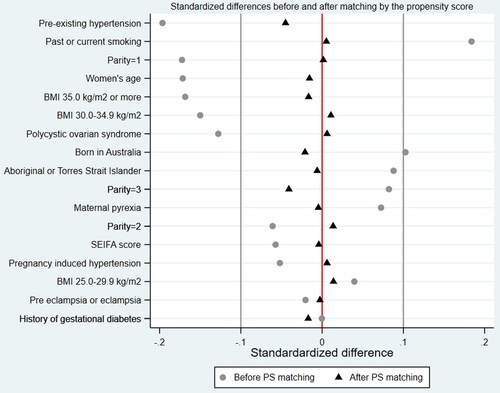
Table 2. Conditional logistic regression! comparing neonatal outcomes in women with and without medically managed GDM (medicated group as reference) following PS matching.
Supplemental material
Supplemental Material
Download MS Word (21.4 KB)Data availability statement
All data generated or analyzed during this study are included in this published article (and its supplementary information files).