
Figures & data
Figure 1. Generation of ESR1D262A mice. (A) Representation of the structure domain within Murine ERα and conservative analysis of amino acids in ESR1 genes across six species. (B) Representation cartoon of the 3D structure of ESR1WT and ESR1D262A mutation type. (C) Schematic illustration of the targeting strategy used to introduce the mutation. (D) Genotyping sequencing of ESR1 gene result of ESR1WT and ESR1D262A mice.
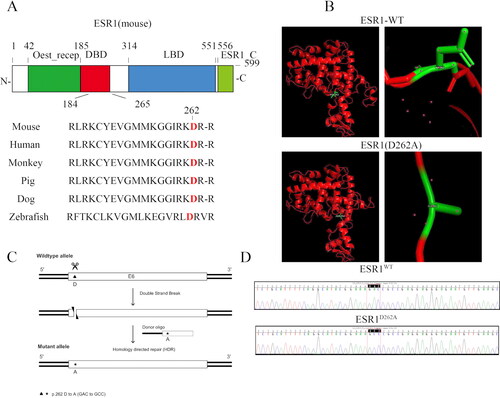
Figure 2. Impaired uterine development and responded with chronic to 17β-estradiol in ESR1D262A mice. (A-D) Mice were sacrificed at the age of 12 weeks, and tissue was dissected. (A) Representative images of ESR1WT and ESR1D262A female reproductive organs. Scale bar = 1 cm. (B) Quantification of uterine wet weight. n = 5. (C) qRT-PCR of ERα, ERβ, SP1, NOS3 and AP1 mRNA transcripts. n = 3. (D) Representative images of ERα immunodetection in transverse uterus sections in WT and ESR1D262A. Scale bar = 200 μM. (E–G) WT and ESR1D262A mice underwent sham or OVX surgery at 8 weeks, with or without E2 treatment for 4 weeks. (E) Representative Ki-67 immunodetection in transverse uterus sections and quantification of percentage of Ki-67 positive cells in the epithelium (F) and average optical density stromal and epithelial compartments from transverse uterine sections (G). Scale bar = 20 μM. n = 3. Data presented mean ± SEM. *p < 0.05 vs. placebo in ESR1WT and ESR1D262A mice respectively. ns. not significant.
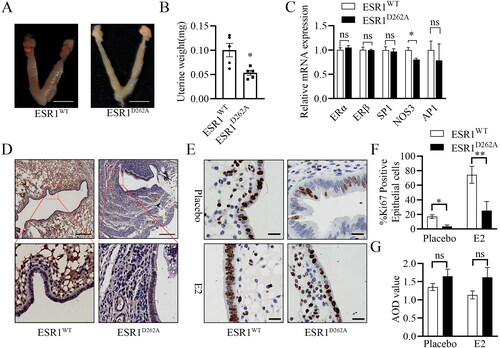
Figure 3. Adult ovarian phenotype is disturbed in the ESR1D262A mice. Representative images of estrous cycles (A) and Histological observation (B) of ovarian in ESR1WT and ESR1D262A mice. Scale bar = 200 μM. (C–G) Serum E2 (C), FSH (D), LH (E) T(F), PG (G) concentration in 12-weeks-old ESR1WT and ESR1D262A mice. n = 4-5. (H) ERα expression in the cell nuclear (NE) and cytoplasmic components (CE) of mouse ovarian tissue. Data presented mean ± SEM. *p < 0.05, ns. not significant. D, diestrus; M, metestrus; E, estrus; P, proestrus.
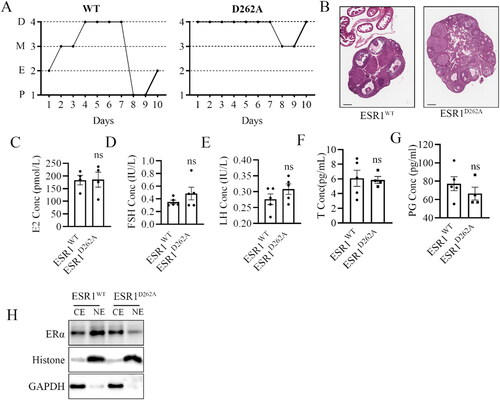
Figure 4. E2-induced vasodilation was attenuated in ESR1D262A mice. (A-D) Representative images of wall tension measurement and vasodilation of ESR1WT (A, B) and ESR1D262A (C, D) mice Aortae. (A, C) Aortae were dissected out and pretreated for 30 min with 200 mM L-NNA (NO inhibitor), and 10 mM indo (prostaglandin synthesis inhibitors) and pre-constricted with phenylephrine (Phe, 10−6 M) before testing with acetylcholine (Ach, 10−5 M), and quantitative analysis was present in the bottom panel (E). (B, D) mutation 262 site in ESR1 gene significantly attenuated E2-induced vasodilation, and quantitative analysis was present in the bottom panel (F). n = 5. Data presented mean ± SEM. *p < 0.05, ns. not significant.
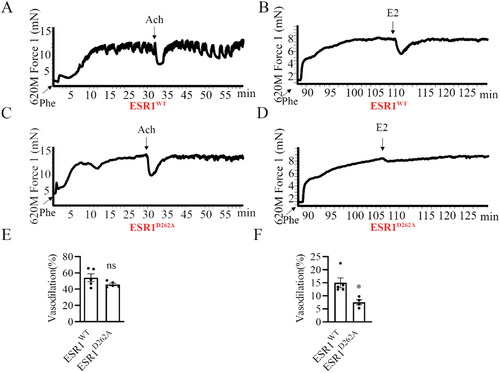
Figure 5. Both genomic and non-genomic effect of E2 phenotype in the aorta is disturbed in ESR1D262A mice. (A) Representative western blotting images of ERα, ERβ, p-eNOs, eNOs, p-AKT, AKT, p-ERK and ERK expression in aorta from 3 paired ESR1WT and ESR1D262A mice. (B) qRT-PCR of ERα, ERβ, SP1, NOS3 and AP1 mRNA transcripts. n = 3. (C) Representative images of serum H2S concentration from ESR1WT and ESR1D262A mice. (D) Quantification of serum H2S concentration from ESR1WT and ESR1D262A mice. n = 3. Data presented mean ± SEM. **p < 0.01. ns. not significant.
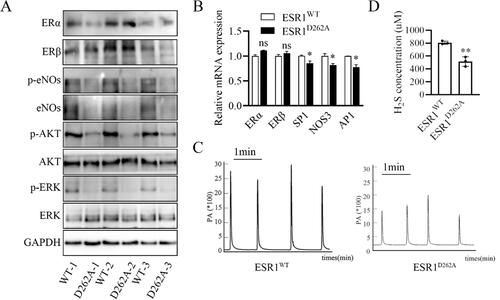
Table 1. detailed information PCR primers.
Table 2. Body weight increase of ESR1D262A mice.