
Figures & data
Figure 1. GFW and rosiglitazone alone or together suppressed body weight and ovarian weight in PCOS rats. (a) The initial weight of rats in each group before the experiment. (b) Weight of rats in each group after dehydroepiandrosterone (DHEA)-induced polycystic ovary syndrome (PCOS) modeling. (c) The final weight of rats in each group. (d) The ovarian weight of rats in each group. Data are expressed as mean ± SD, n = 10. ▲▲p < .01 vs. control group; ★p < .05, ★★p < .01 vs. DHEA group; ##p < .01 vs. Guizhi Fuling Wan (GFW) group; $$p < .01 vs. rosiglitazone group.
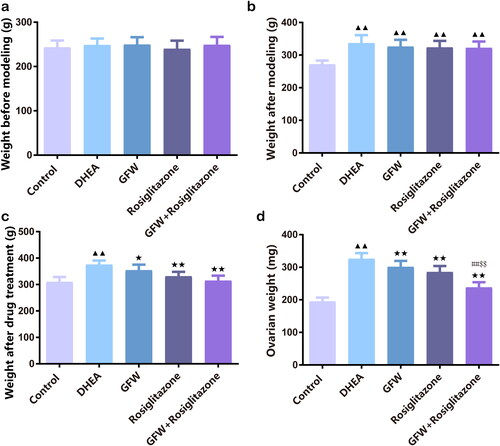
Figure 2. The FBG, FINS, and HOMA-IR levels in PCOS rats were decreased after GFW and rosiglitazone alone or co-treatment. (a) A blood glucose meter was selected to monitor fasting blood glucose (FBG) of each group. (b) For determination of fasting insulin (FINS), Rat Insulin ELISA Kit was applied. (c) The homeostasis model assessment of insulin resistance (HOMA-IR) was calculated based on the formula: FBG (mmol/L) × FINS (mU/L)/22.5. Data are displayed as mean ± SD, n = 10. ▲▲p < .01 vs. control group; ★p < .05, ★★p < .01 vs. DHEA group; #p < .05, ##p < .01 vs. GFW group; $p < .05 vs. rosiglitazone group.
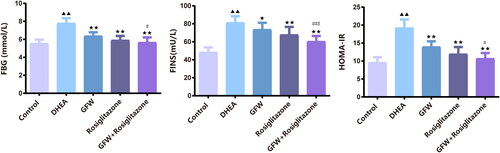
Figure 3. GFW and rosiglitazone alone or combination ameliorated estrous cycle in DHEA-induced PCOS rats Vaginal smears determined the stage of estrous cycle in rats.
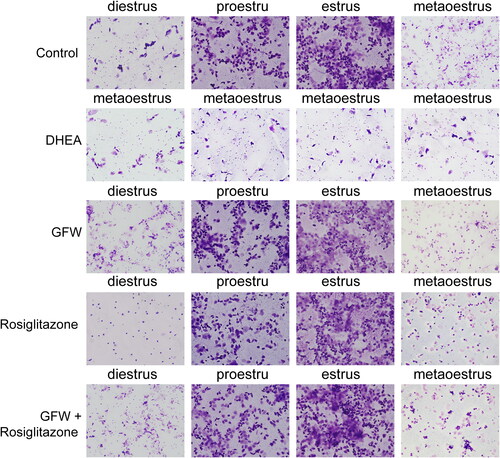
Figure 4. The effects of GFW and rosiglitazone on lipid metabolism levels in PCOS rats. For determination of lipid metabolism levels, total cholesterol (TC), triglyceride (TG), low-density lipoprotein (LDL), and high-density lipoprotein (HDL) levels were evaluated by applying an automatic biochemical analyzer. Data are displayed as mean ± SD, n = 10. ▲▲p < .01 vs. control group; ★★p < .01 vs. DHEA group; #p < .05, ##p < .01 vs. GFW group; $p < .05, $$p < .01 vs. rosiglitazone group.
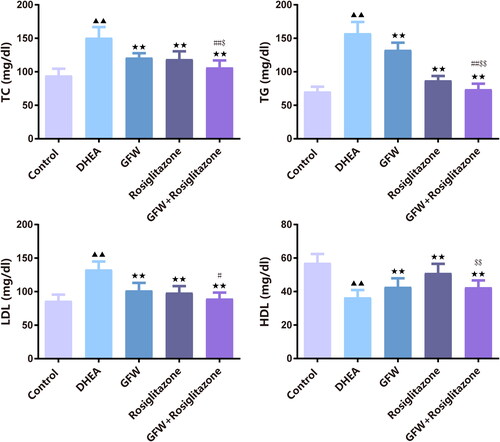
Figure 5. The effects of GFW and rosiglitazone on ovarian sex hormone levels in PCOS rats. The contents of testosterone (T), estradiol (E2), progesterone (P), luteinizing hormone (LH), and follicle stimulating hormone (FSH) were analyzed utilizing ELISA. Data are described as mean ± SD, n = 10. ▲▲p < .01 vs. control group; ★p < .05, ★★p < .01 vs. DHEA group; #p < .05, ##p < .01 vs. GFW group; $p < .05, $$p < .01 vs. rosiglitazone group.
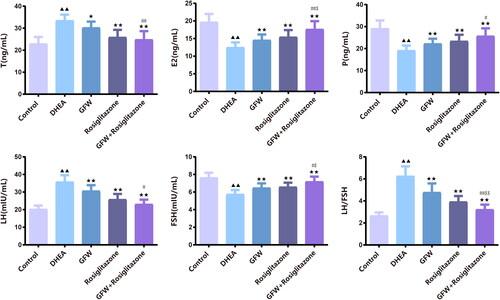
Figure 6. GFW and rosiglitazone co-intervention ameliorated ovarian histological change and follicular development in PCOS rats. (a) Hematoxylin and eosin (H&E) staining assessed the pathological change of the ovarian tissues (×40, ×200, ×400). (b) The number of follicles at all levels of the ovarian tissues was counted. (c) H&E staining of overall structure of ovary. Data are described as mean ± SD, n = 6. ▲▲p < .01 vs. control group; ★p < .05, ★★p < .01 vs. DHEA group; ##p < .01 vs. GFW group; $p < .05, $$p < .01 vs. rosiglitazone group.
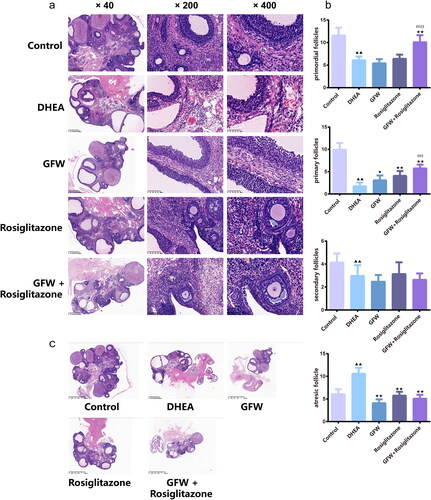
Figure 7. The combined GFW and rosiglitazone alleviated serum oxidative stress response in PCOS rats. (a) The serum glutathione peroxidase (GSH-Px), malondialdehyde (MDA), and superoxide dismutase (SOD) levels were examined by ELISA. (b) The ovarian tissue GSH-Px, MDA, SOD levels were examined by ELISA. Data are described as mean ± SD, n = 10. ▲▲p < .01 vs. control group; ★p < .05, ★★p < .01 vs. DHEA group; ##p < .01 vs. GFW group; $p < .05, $$p < .01 vs. rosiglitazone group.
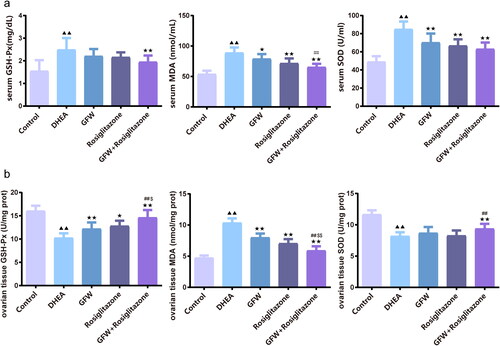
Figure 8. The combined GFW and rosiglitazone alleviated serum inflammatory response in PCOS rats. The serum C-reactive protein (CRP), interleukin-18 (IL-18), tumor necrosis factor-α (TNF-α), interleukin-6 (IL-6), and interleukin-1β (IL-1β) levels were assessed by ELISA. Data are described as mean ± SD, n = 10. ▲▲p < .01 vs. control group; ★p < .05, ★★p < .01 vs. DHEA group; ##p < .01 vs. GFW group; $p < .05 vs. rosiglitazone group.
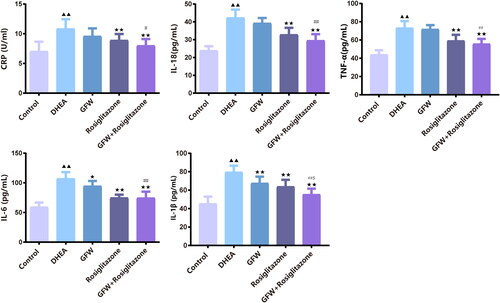
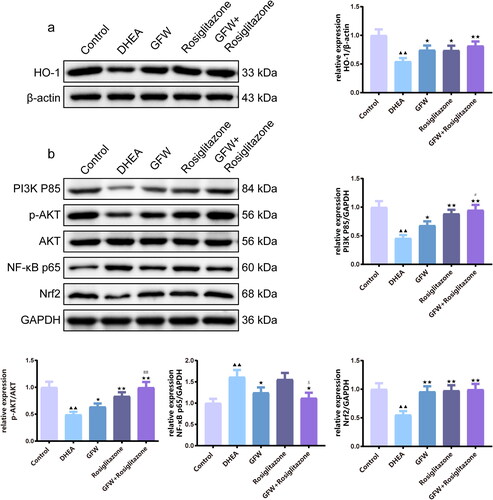
Figure 9. The effects of GFW and rosiglitazone on PI3K/AKT/NF-κB and Nrf2/HO-1 pathways of the ovarian tissues in PCOS rats. (a,b) The effects of GFW and rosiglitazone on phosphoinositide 3-kinase (PI3K)/protein kinase B (AKT)/nuclear factor-kappaB (NF-κB) and nuclear factor erythroid 2-related factor 2 (Nrf2)/heme oxygenase-1 (HO-1) pathways of the ovarian tissues in PCOS rats were evaluated by Western blot. Data are manifested as mean ± SD, n = 3. ▲▲p < .01 vs. control group; ★p < .05, ★★p < .01 vs. DHEA group; #p < .05, ##p < .01 vs. GFW group; $p < .05 vs. rosiglitazone group.
Supplemental Material
Download MS Word (17.1 MB)Data availability statement
Data will be provided upon request.