Figures & data
Figure 1. Overview of experimental design (made with figdraw).
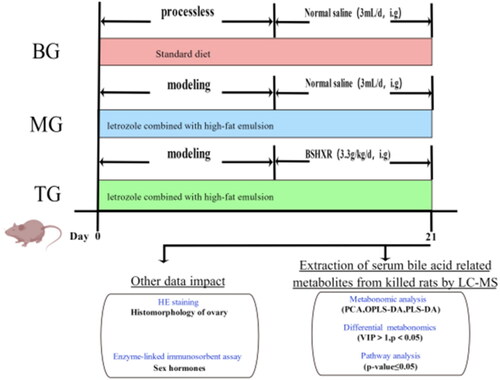
Figure 2. (a), (b) and (c) revealed the Influence of PCOS modeling on the estrous cycle of rats; E denoted Estrus, M denoted metestrus, D denoted diestrus, and P denoted proestrus. (d), (e) and (f): Histomorphology of ovaries of rats in three groups (HE, ×40).
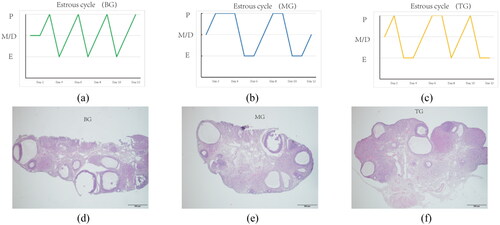
Table 1. The body weight of rats in the three groups.
Table 2. Effects of modeling and BSHXR on T, FSH, and LH in rats.
Figure 3. A-b represents BG, B-b represents mg and D-b represents TG (the following Figures have the same meanings as here). (b), (c) and (d): PCA model plots after pairwise comparison of three groups of samples. (e), (f) and (g): PLS-DA model plots after pairwise comparison of three groups of samples. (h), (f) and (j): OPLS-DA model plots after pairwise comparison of three groups of samples. (k) and (l): response sorting test results of OPLS-DA model (Q2 (cum) indicated the predictive ability of the model, with Q2 (cum) > 0.5 being considered a valid model or Q2 (cum) > 0.9 being an excellent model).
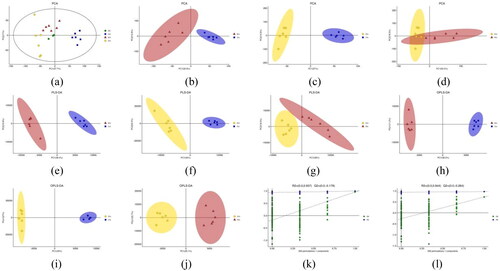
Table 3. Table of model parameters for comparative analysis between two groups.
Figure 4. Volcano plots were used to visualize the experimental values.
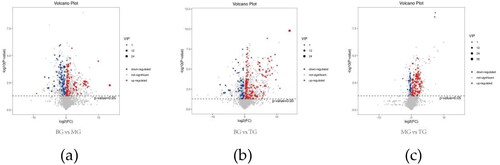
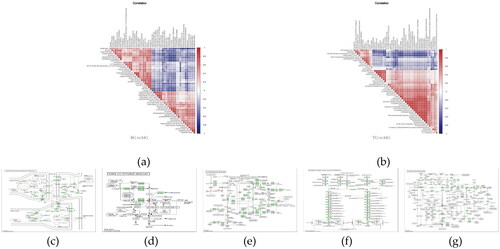
Figure 5. The above two heat maps represent the content and types of differential metabolites between different groups. In a heat map, the warmer the color, the higher the content, while the cooler the color, the lower the content. (a) revealed heat map of differential metabolites between BG and MG groups. (b) revealed heat map of differential metabolites between MG and TG groups.
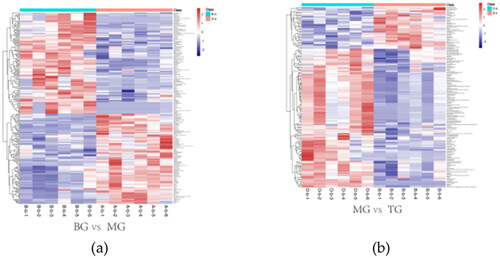
Figure 6. (a) and (b) Correlation analysis can help measure how closely the significantly different metabolites are related to each other and provide further insight into metabolite interrelationships during changes in biological state. (c)–(g) Small circles indicate compounds. Metabolites identified in red are up-regulated compounds detected in this experiment and blue are down regulated compounds. Arrows indicate direction of reaction. Small boxes indicate enzymes; Small green boxes indicate enzymes unique to the species; large oblique squares indicate other metabolic pathways.