
Figures & data
Table 1. The primary characteristics of the eligible studies.
Table 2. Basic information of the articles included in this study.
Figure 1. Forest plot of maternal age (year) and gestational age (week). A: Age (year); B: gestational age (week). SMD: Standardized mean difference; black dots: point estimates of effect sizes for each study; squares: weights of each study; line segment length: 95% confidence interval for each study’s effect size; diamond: summary effect size from meta-analysis; width of diamond: 95% confidence interval for the summary effect size.
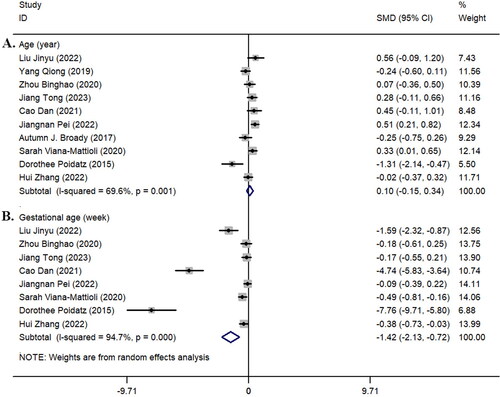
Figure 2. Forest plot of systolic blood pressure (SBP) and diastolic blood pressure (DBP). A: SBP; B: DBP.
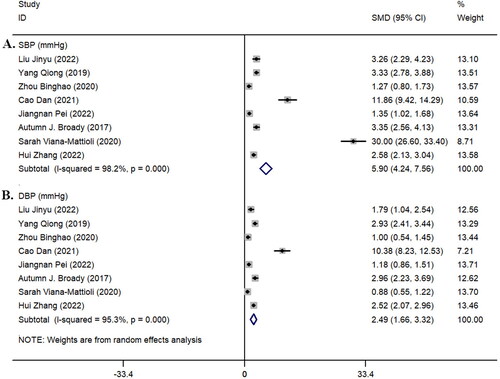
Figure 3. Forest plot of parity and gravidity in the included study population. A: Gravidity; B: Number of births.
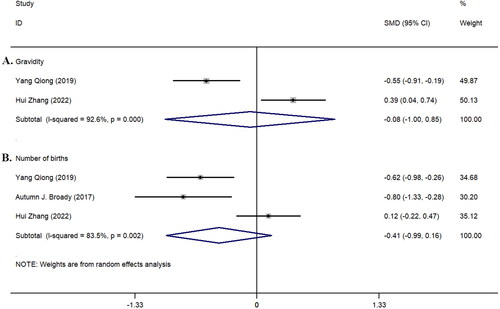
Figure 4. Forest plot of BMI (Kg/m^2), newborn birth weight, and placental weight in the included study population. A: BMI (Kg/m^2); B: newborn birth weight; C: Placental weight.
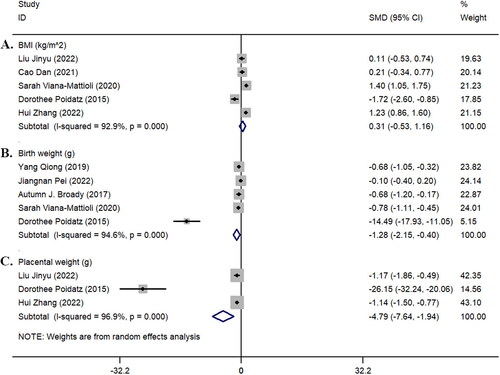
Figure 5. Forest plot of immunohistochemistry detection of placental tissue in the included study population. RR: Relative risk.
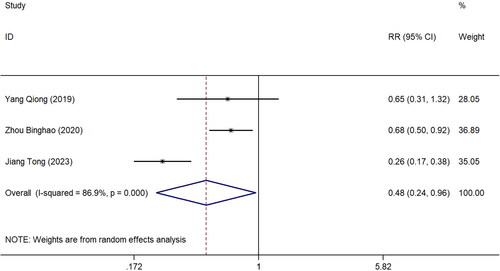
Figure 6. Forest plot of ELISA detection of plasma, qRT-PCR detection of mRNA, and Western Blotting (WB) protein detection in the included study population. A: ELISA detection; B: qRT-PCR detection; C: WB detection.
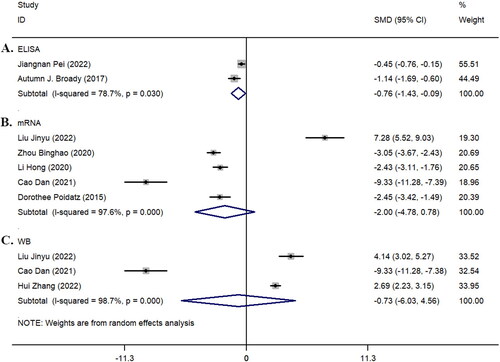
Table 3. Different detection methods were used to assess the expression of SIRT1 in the two groups.
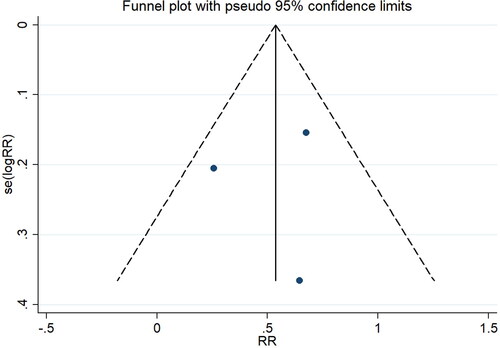
Figure 7. Funnel plot of studies using immunohistochemistry detection. RR: Relative risk.
Data availability statement
The data that support the findings of this study are available from the corresponding author upon reasonable request.