
Figures & data
Table 1. RT-PCR primers.
Figure 1. Expression of IL-6/IL-8 (A), HMHB1 (B), and TLR4 (C) in the CE, EuE, and EE groups. **p < .01.
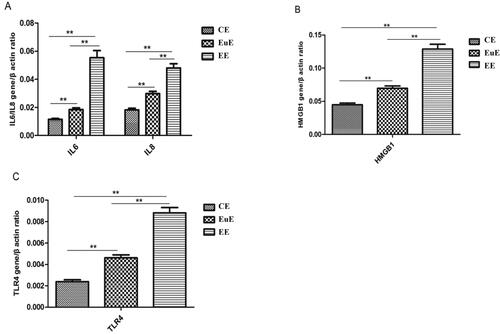
Figure 2. Expression of HMHB1 (D) and TLR4 (E) proteins in the CE, EuE, and EE groups. **p < .01.
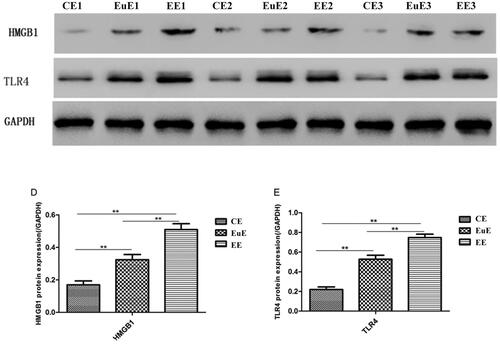
Figure 3. Expression of IL-6/IL-8 and TLR4 proteins in the CE, EuE, and EE groups.
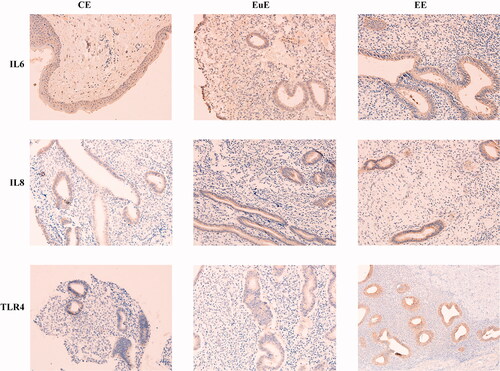
Figure 4. Correlation of mRNA HMGB1 expression with TLR4, IL-6, and IL-8 (A), TRL4 with IL-6 and IL-8 (B), and TLR4 with HMGB1 (C) in the EuE and EE groups.
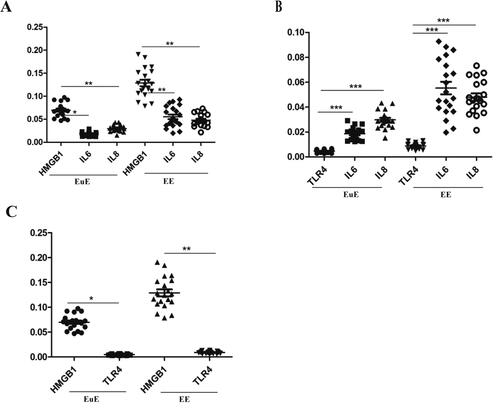
Table 2. Correlation between HMGB1 expression and IL-6 and IL-8 in EuE and EE.