
Figures & data
Table 1. Characteristics of the OE and control patients whose samples were used for ELISA Analyses.
Figure 1. The concentrations of protein in follicular fluid (FF) of control group (control) and ovarian endometriosis group (OE). The concentrations of FTO and METTL3 in FF of women with OE (n = 37) were lower than that of the control group (n = 37, *p <.05, (A,C). The concentrations of KIAA1429 in FF of women with OE (n = 37) were higher than that of the control group (n = 37, ***p <.0001, E).
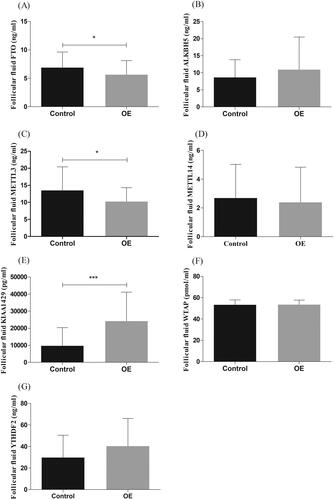
Figure 2. Expression of FTO in granulosa cells (GCs) of women with ovarian endometriosis (OE). (A) FTO levels were significantly lower in women with OE (n = 21) compared with women in control group (n = 19, *p <.05). (B) The content of m6A in GCs of women with OE (n = 10) was higher than that of the control group (n = 10, p >.05).
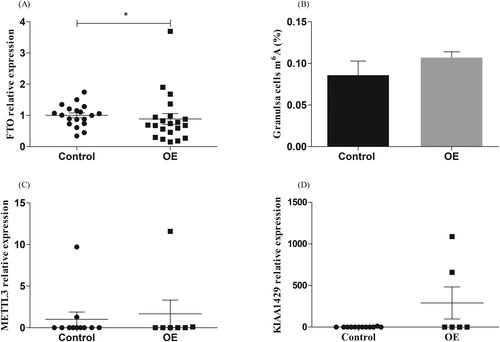
Table 2. ART cycle Characteristics in OE and control patients.