Figures & data
Table 1. Primer sequences used in RT-PCR.
Figure 1. (A) Representative RT-PCR analysis of AMHRII transcript expression in human fetal osteoblast cell line (HOb) and granulosa cells of three independent cell cultures. (B) Representative Western blot analysis of AMHRII protein expression in human fetal osteoblast cell line (HOb) and granulosa cells. Densitometric absorbance values from three independent experiments were averaged (± S.D) and were expressed as arbitrary units (a.u.). (C) Western blot analysis of pSMAD1/5 expression in the human fetal osteoblast cell line (hob). in the figure was reported a representative blot. Densitometric absorbance values from three separate experiments were averaged (±S.D) and were expressed as arbitrary units (a.u.). Vinculin was used as internal control. ** p < 0.01; ***p < 0.001 versus respective control (CTRL). (D) Western blot analysis of pSMAD3 expression in the human fetal osteoblast cell line (hob). in the figure was reported a representative blot. Densitometric absorbance values from three separate experiments were averaged (±S.D) and were expressed as arbitrary units (a.u.). Vinculin was used as internal control. * p < 0.05 versus respective control (CTRL).
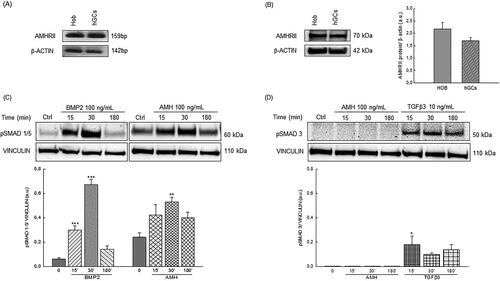
Figure 2. (A) Effect of AMH (100 ng/mL) at different times of treatment on cellular growth evaluated by trypan blue staining. Data are the mean ± S.D of three independent experiments performed in triplicate and were expressed as fold increase respect to the number of cells present at time 0 arbitrarily set to 1. **p < 0.01; ***p < 0.001. (B) Optical density of HOb cells treated for 24, 48 and 72 h with 100 ng/mL AMH after CCK-8 cytotoxicity assay. Data are the mean ± S.D of three independent experiments performed in triplicate. (C) Levels of expression of RUNX2, OX, OPN, and OC genes were analyzed by Real time-PCR. The levels of the transcripts were normalized with the housekeeping gene (RPS7). Data are the mean ± S.D of three independent experiments performed in triplicate and were expressed as fold increase respect to the respective control set equal to 1. *p < 0.05; **p < 0.01 versus CTRL.
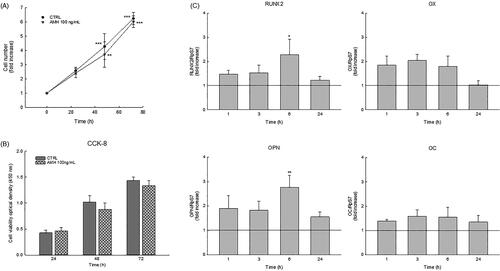
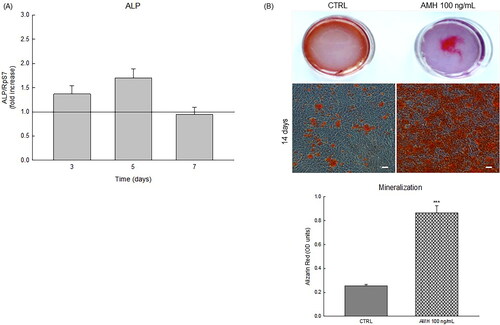
Figure 3. (A) Relative mRNA expression level by Real time-PCR of alkaline phosphatase (ALP) cultured in osteogenic medium both in the presence and in the absence of 100 ng/mL AMH. (B) Alizarin Red staining of calcium deposition in human fetal osteoblast cell line (HOb) plate view (upper) and microscopic view (lower) of the staining on day 14 of AMH (100 ng/mL) treatment. Intensity of Alizarin Red stains, which refers to quantity of mineralization process, was examined. Graph data are shown as mean ± S.D of three independent experiments. ***p < 0.001 versus control (CTRL).