Figures & data
Figure 1. FTO expression was upregulated in human follicular fluid (FF) and granulosa cells (GCs) clinically. A FSHR expression in GCs of patients. B mRNA expression levels of FTO in GCs in PCOS and control (control, n = 16; PCOS, n = 15). m6A content in GCs in PCOS and control (control, n = 13; PCOS, n = 14). Correlation analysis between FTO and m6A level in GCs. C secretion levels of FTO (pg/ml) and androgen (ng/ml) in human FF of PCOS and control (control, n = 15; PCOS, n = 14). Correlation analysis between FTO and androgen concentration in FF (control, n = 15; PCOS, n = 14). Data are presented as the mean ± SD. *p < .05**p < .01***p < .001.
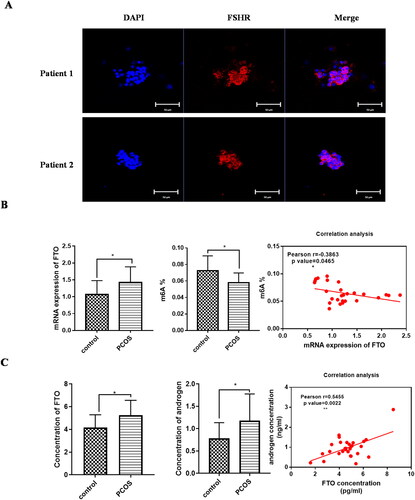
Table 1. Demographic and clinical characteristics of included patients.
Figure 2. FTO expression was increased in PCOS model in vivo. A secretion levels of FTO and hormones in serum in PCOS rat and control (control, n = 8; PCOS, n = 8). B ovary sections stained by hematoxylin-eosin. The number analysis of cystic follicles (Cys) and corpora lutea (CL)in PCOS rat and control. C FTO protein level of the ovary of PCOS rat and control by Western blot, band intensity was calculated by Image J. D FTO mRNA expression in the ovary of PCOS rat and control. E the m6A content in the ovary of PCOS rat and control. F FTO protein level of the ovary of PCOS rat and control by immunocytochemistry. Scale bar, 500 μm. Average optical density (AOD) was analyzed by Image-pro plus. Data are presented as the mean ± SD. *p < .05, **p < .01, ***p < .001.
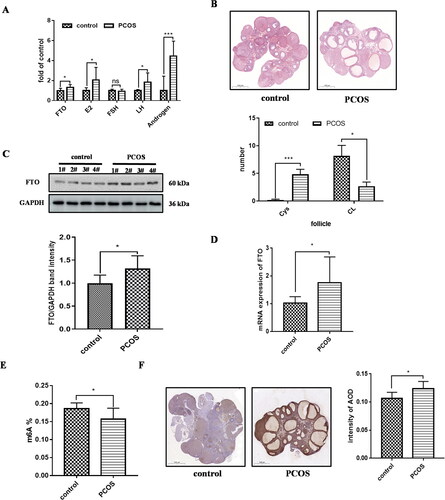
Figure 3. FTO expression was increased exposed to DHT in GC line cells. A FSH receptor (FSHR) expression in GCs. B and C protein and mRNA level of FTO in GCs treated with a gradient of DHT, band intensity was calculated by Image J. D the m6A content in GCs treated with a gradient of DHT. All experiments were performed three times. Data are presented as the mean ± SD. *p < .05, **p < .01, ***p < .001.
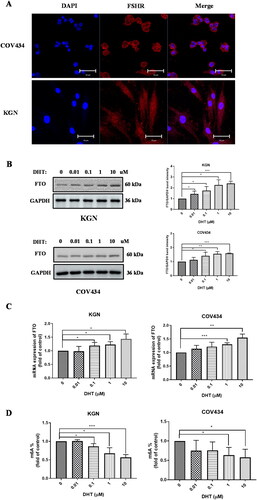
Figure 4. Inhibition of FTO decreased steroid hormone synthetase and androgen receptor (AR) expression in GCs. A mRNA expression of FTO in KGN cells transfected with siRNA targeting FTO. B and C the effect of inhibition of FTO expression to steroid hormone synthetase and AR. Band intensity was calculated by Image J. All experiments were performed three times. Data are presented as the mean ± SD. *p < .05, **p < .01, ***p < .001.
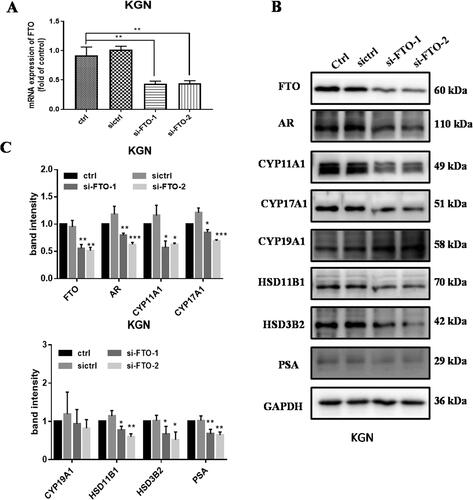
Figure 5. Inhibition of FTO decreased cell survival and AR/AKT signaling. A the effect of MA on cell survival. The cells were exposed to gradient MA for 24, 48 and 72h by Resazurin sodium salt assay. B the expression level of FTO, AR/PSA and P-AKT in KGN cells exposed to 1uM DHT with or without 50uM MA for 48h. Band intensity was calculated by Image J. C confocal microscopy analysis to detect the colocalization of FTO and AR in KGN cells. Red, FTO; green, AR; nucleus was stained by DAPI. Scale bar, 20 μm. The plot profile of fluorescence intensity was used to show the overlap of the FTO and AR. Overlap coefficient (OC) was >0.6 as the indication colocalization. D Co-immunoprecipitation assay by the antibody of FTO or AR to show FTO-AR interaction in KGN cell lines.
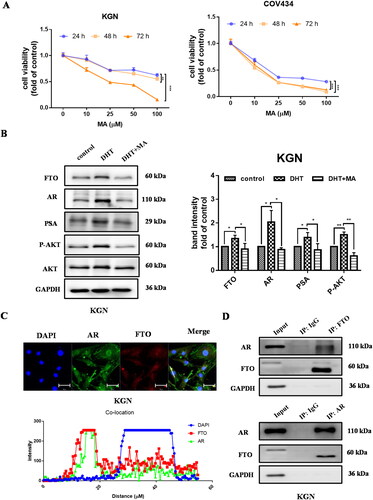
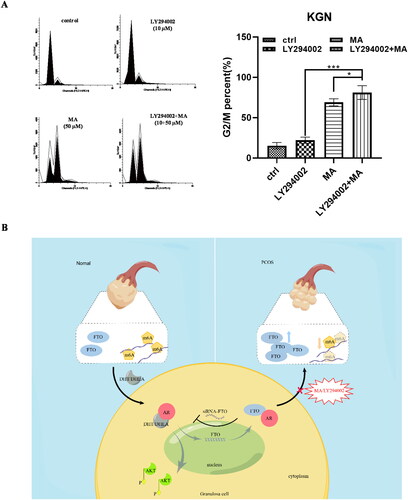
Figure 6. Combination of MA with LY294002 synergistically inhibited GCs line cell survival. A cell survival of GCs cells treated with MA in the presence or absence of LY294002 for 48 h using EdU analysis. B-D cell survival of GCs cells treated with MA and LY294002 at indicated concentrations. FA-CI and isobologram analysis for MA and LY294002 combinations was plotted and calculated with Chou–Talalay algorithms. CI < 1, synergism; CI = 1, additive; CI > 1, antagonism. Isobologram analysis represents the synergism of a combination of MA with LY294002. Data were shown as mean ± SD from three independent experiments, and cells in three random fields were analyzed. *p < .05, **p < .01, ***p < .001.
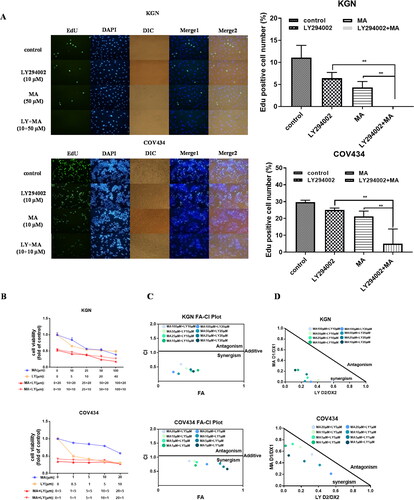
Figure 7. A FACS analysis of cell cycle in KGN cells. The cells were treated with LY29004(10 μM), MA (50 μM), combined MA with LY294002 for 48 h. Untreated cells were used as control. B working model (by figdraw ID: YSPWRbd849). FTO upregulation stimulated by AR activation promoted hyperandrogenism of PCOS. FTO inhibition showed the ability of blocking hyperandrogenism progression and cell proliferation by impeding AR-AKT signaling axis of GCs.