
Figures & data
Figure 1. Framework flowchart. This figure shows the detailed selection criteria and steps of bibliometric analysis for early release ovarian insufficiency (POI) gene publications in the WoSCC database.
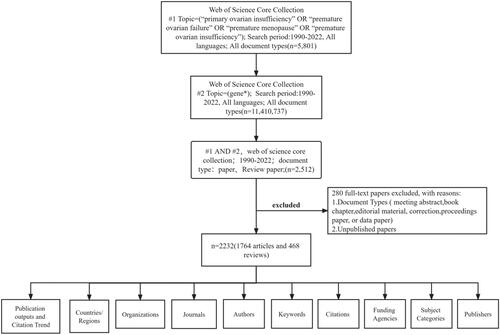
Figure 2. Trends in the number of published papers and citations for POI genes from 1990–2022.
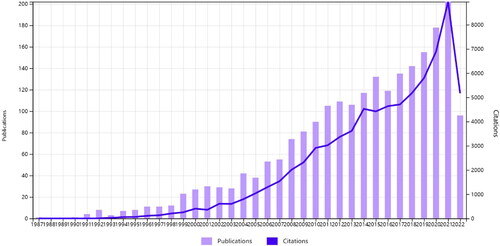
Figure 3. (A) Co-authorship analysis of countries. The analysis was performed using VOSviewer 1.6.14 with the method linlog/modularity, weighted by the number of citations, and scored as the average year of publication. The thickness of the lines indicates the strength of the relationship. The color indicates the average year of publication. Five occurrences were included only. (B) National/regional collaborations leading to POI-gene publication from 1990–2022. (C) Countries with the highest number of citations in POI-gene papers from 1990–2022.
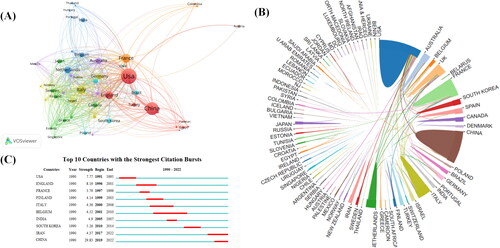
Table 1. Top 10 countries/regions and institutions with the most published POI-genes papers from 1990–2022, along with citation frequency and total linkage intensity.
Table 2. The top 10 organizations with the highest output in POI gene research from 1990 to 2022.
Table 3. Ten journals with the highest number of publications in POI-genes from 1990 to 2022.
Figure 4. Co-authorship analysis of organizations. (A) Analysis was performed using VOSviewer 1.6.14 with the method linlog/modularity, weight as a number of citations, and score as the average year of publication. The thickness of the lines indicates the strength of the relationship. The color indicates the average year of publication. Five occurrences were included only. (B) The 25 organizations with the strongest CiteSpace citation burst. ɣ:1.0, minimum duration:2.
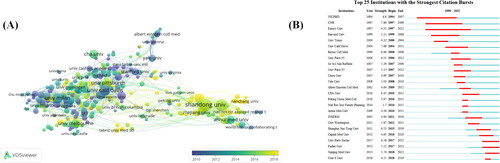
Figure 5. Citation analysis of journal. The analysis was performed using VOSviewer 1.6.14 with the method linlog/modular, weighted by citation volume, and scored as the mean year of publication. The thickness of the lines indicates the strength of this relationship. The color indicates the average year of publication. Five occurrences were included only.
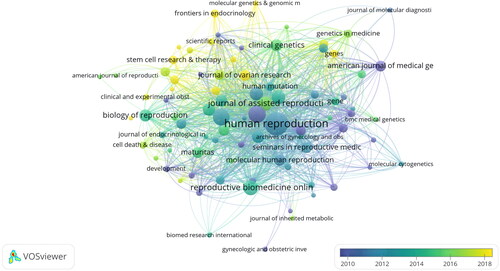
Table 4. Ten core authors with the highest number of publications in POI-genes from 1990 to 2022.
Figure 6. Co-authorship analysis of authors. (A) The analysis method is linlog/modularity in VOSviewer, with weights as a number of citations. The thickness of the lines indicates the strength of the relationship. (B) Top 25 most cited authors according to CiteSpace. ɣ: 1.0, minimum length: 2.
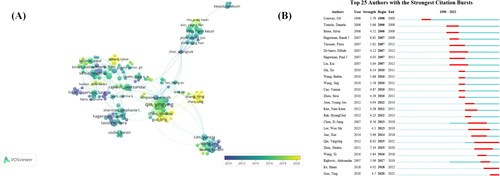
Figure 7. Co-occurrence analysis of the authors keywords. (A) The analysis method is modularity in linlog/VOSviewer, with a weight of one event and a score of the average year of publication. The thickness of the lines indicates the strength of the relationship. The color indicates the average year of publication. (B) Top 25 keywords with the strongest CiteSpace citation burst. ɣ:1.0; minimum duration:2. (C) Relationships between genes and other authors’ keywords were performed by network visualization. Figure 8. Analysis of co-references. (A) Top 20 documents with the strongest CiteSpace citation burst. ɣ:1.0; minimum duration:2. Light color indicates the time range from 1990-2022 statistics, dark cyan indicates the time range from publication to the strongest citation burst, and red indicates the duration of the strongest citation burst. (B)The analysis method is modularity in linlog/VOSviewer with weights of citation counts. The thickness of the lines indicates the strength of the relationship. The purple part of the circle indicates the Central position of the document.
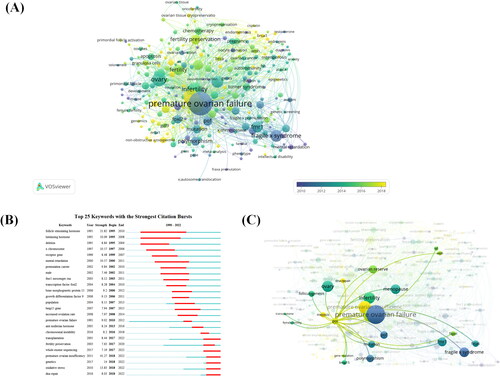
Figure 8. Analysis of co-references. (A) Top 20 documents with the strongest CiteSpace citation burst. ɣ:1.0; minimum duration:2. Light color indicates the time range from 1990-2022 statistics, dark cyan indicates the time range from publication to the strongest citation burst, and red indicates the duration of the strongest citation burst. (B)The analysis method is modularity in linlog/VOSviewer with weights of citation counts. The thickness of the lines indicates the strength of the relationship. The purple part of the circle indicates the Central position of the document.
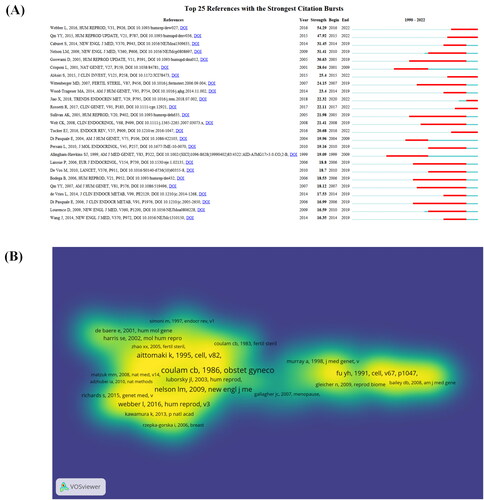
Table 5. Top 10 most cited POI-gene articles from 1990 to 2022.
Table 6. The 10 fund institutions that received the most funding for POI gene papers from 1990 to 2022.
Table 7. The 10 disciplines that published the most POI gene papers from 1990 to 2022.
Data availability statement
The dataset provided in this study can be found in the https://www.webofscience.com/wos/alldb/basic-search. The article/supplement contains the original research. For further requests, please contact the corresponding author directly.