
Figures & data
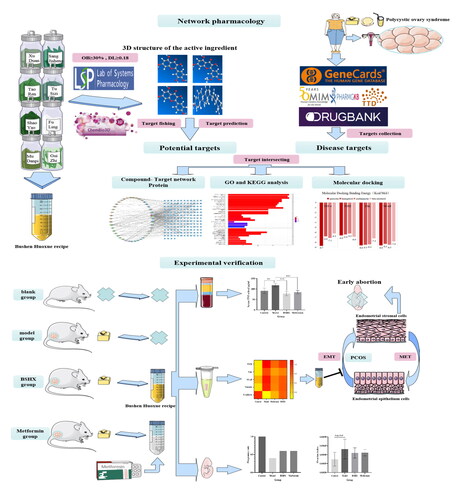
Figure 1. Network pharmacology analysis results in presentation. a: Disease target and drug-disease shared target acquisition. b: Bushen Huoxue Recipe (BSHX) " Chemical Composition-Common Targets-Disease Information Network Diagram. c: Protein-protein interaction (PPI) network diagram of key and core targets.
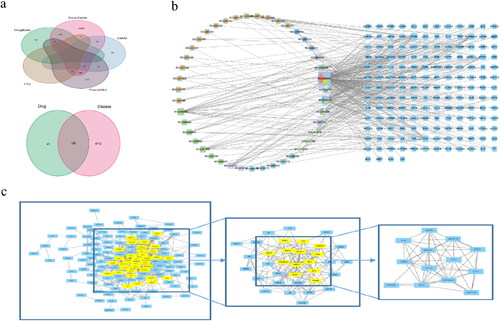
Table 1. Information of active ingredients and predicted targets in the Bushen Huoxue Recipe.
Table 2. Information on the ranking of active ingredients in the treatment of polycystic ovary syndrome with the Bushen Huoxue Recipe.
Figure 2. GO and KEGG pathway analysis.
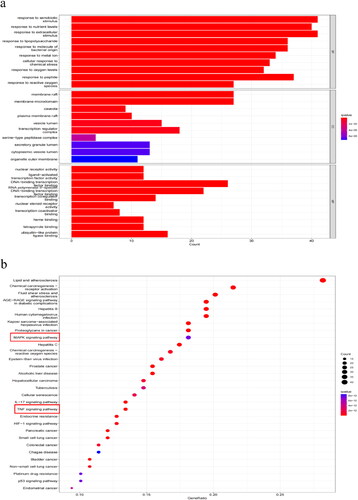
Figure 3. Molecular docking animation and binding energy demonstration. a: Docking animation of TNF-α (-8.7kcal/mol), NF-κB (-8.6kcal/mol), TAK1 (-8.6kcal/mol), TGFβ (-6.6kcal/mol) and quercetin molecules. b: Docking binding ability of quercetin, kaempferol, isorhamnetin, and beta-sitosterol with TNF-α, TGFβ, TAK1, and NF-κB molecules.
Figure 4. Basic conditions of rats in each group. a: Body mass growth index of rats and ovarian index of rats. Data are shown as mean ± SD (n = 8), and data between multiple groups were compared by one-way analysis of variance (ANOVA). b: Rat ovary sections (HE staining). c: Vaginal exfoliated cell map of rats in the control group. d: Estrus cycle curves diagram for each group of rats.
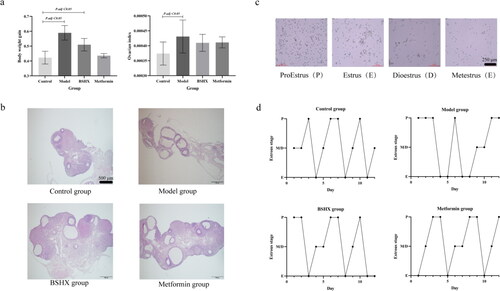
Figure 5. Uterine tissue morphology and pregnancy in rats of four groups. a: Rat endometrial tissue (HE staining). b: Pregnancy loci of rats.
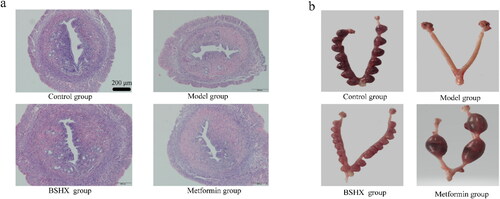
Table 3. Diameter of the rat uterus, thickness of the endometrium, and number of endometrial glands in different groups.
Table 4. Pregnancy rate and the number of embryos in different groups.
Figure 6. Serum TNF-α levels, and levels of target proteins and EMT-related proteins in rat endometrial tissue. a: Endometrial TGF-β, TAK, NF-κB, E-cadherin, and Vimentin WB results. b: Endometrial TGF-β, TAK, NF-κB, Vimentin Heatmap Display. c: Serum TNF-α levels in rats (*p < .05, **p < .01, ***p < .001). Levels of TGFβ, TAK, and NF-κB in rat endometrial tissue and levels of EMT-related proteins Vimentin and E-cadherin in the endometrium. Data are shown as mean ± SD (n = 5), and data between multiple groups were compared by one-way ANOVA. Compared with the control group: *p < .05, **p < .01, ***p < .001; compared with the model group: #p < .05, ##p < .01, ###p < .001; compared with the metformin group: ▲p < .05, ▲▲p < .01, ▲▲▲p < .001.

Data availability statement
We are open to providing our research data. The data that support the findings of this study are openly available in 10.6084/m9.figshare.24156384.