
Figures & data
Figure 1. DKK1 is downregulated in PCOS. (A) for Comparison of rat ovarian structure from Control (n = 6) and PCOS (n = 6) groups by H&E staining. (B and C) DKK1 mRNA and protein expression in ovaries from Control and PCOS rats by RT-qPCR and Western blotting. *p < .05; **p < .01.
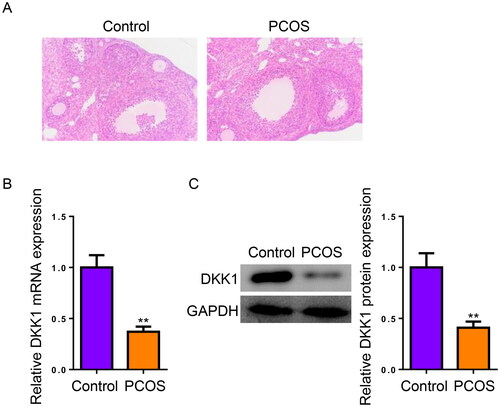
Figure 2. DKK1 modulates proliferation and apoptosis in KGN cells. (A and B) DKK1 mRNA and protein expression in KGN cells transfected with siNC, siDKK1, Vector, or DKK1. (C) CCK-8 assay for proliferative capacity of KGN cells. (D and E) Flow cytometry for the apoptotic ratio of KGN cells. *p < .05; **p < .01.
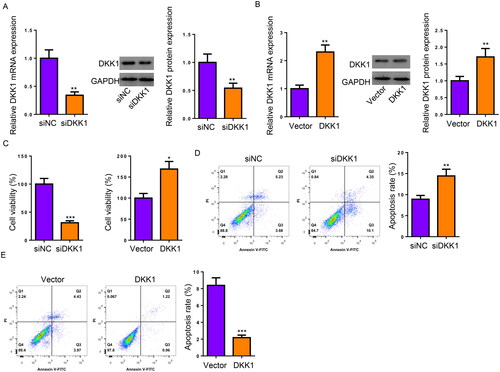
Figure 3. DKK1 regulates KGN cell proliferation and apoptosis by targeting the TGF-β1/SMad3 signaling. (A and B) TGF-β1 and Smad3 mRNA and protein levels in ovaries from Control and PCOS rats. (C) Association between DKK1 and TGF-β1 expression in ovaries from Control and PCOS rats. Then, KGN cells were assigned into Control, DKK1, SRI-011381, and DKK1 + SRI-011381 groups. (D) Protein levels of TGF-β1, Smad3, and p-Smad3 in KGN cells. (E) CCK-8 assay for proliferative capacity of KGN cells. (F) Flow cytometry for the apoptotic ratio of KGN cells. *p < .05; **p < .01.
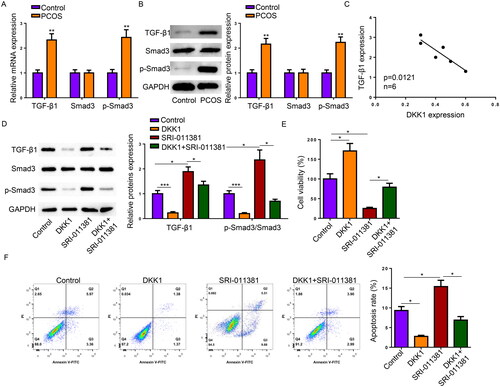
Figure 4. SIRT2 participates in DKK1-mediated regulation of KGN cell proliferation and apoptosis. (A and B) SIRT2 mRNA and protein levels in ovaries from Control and PCOS rats. Then, KGN cells were assigned into Control, siDKK1, AGK2, and siDKK1 + AGK2 groups. (C) CCK-8 assay for proliferative capacity of KGN cells. (D) Flow cytometry for the apoptotic ratio of KGN cells. *p < .05; **p < .01.
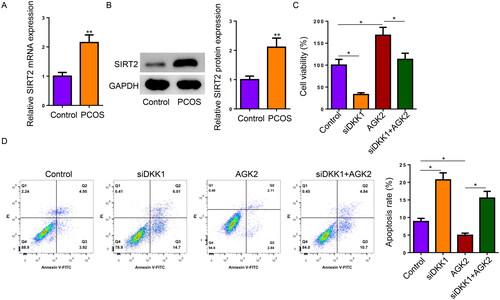
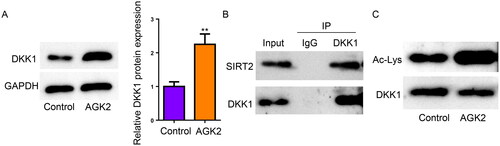
Figure 5. SIRT2 deacetylates DKK1 in KGN cells. (A) Protein level of DKK1 in KGN cells from Control and AGK2 groups. (B) Co-IP assay for the association between SIRT2 and DKK1 expression in KGN cells. (C) IP assay for DKK1 acetylation in KGN cells from Control and AGK2 groups. *p < .05; **p < .01.
Availability of data and materials
The datasets used and/or analyzed during the current study are available from the corresponding author upon reasonable request.