
Figures & data
Figure 1. Screening conditions for 60 cases in the growth hormone therapy group.
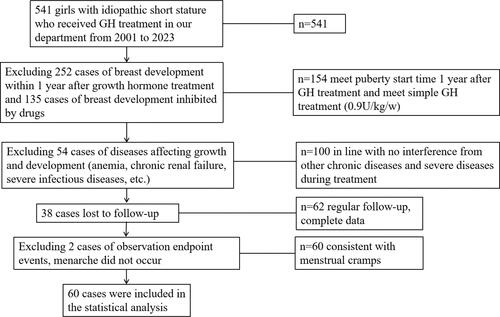
Figure 2. (A) Comparison of age at puberty; (B) comparison of age at menarche; (C) comparison of the period of sexual maturation; (D) comparison of height at puberty; (E) comparison of height at menarche; (F) comparison of height growth from puberty to menarche.
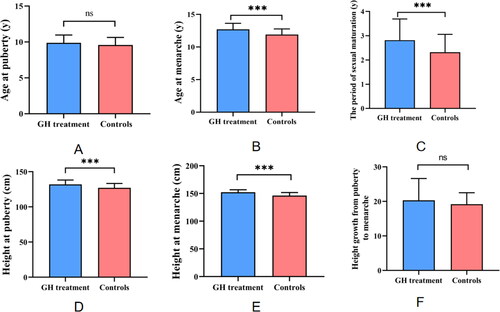
Table 1. Comparison of developmental indicators between the treatment group and the control group.
Figure 3. (A) The correlation between GH usage time and age at onset of development; (B) the correlation between GH usage time and age at menarche.
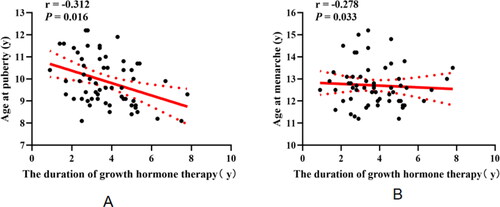
Table 2. Correlation analysis of GH usage duration and development indicators in the treatment group.
Data availability statement
The datasets generated and/or analyzed during the current study are not publicly available due to confidentiality agreements and the need to adhere to ethical guidelines but are available from the corresponding author upon reasonable request.