
Figures & data
Figure 1. Flow chart of study selection.
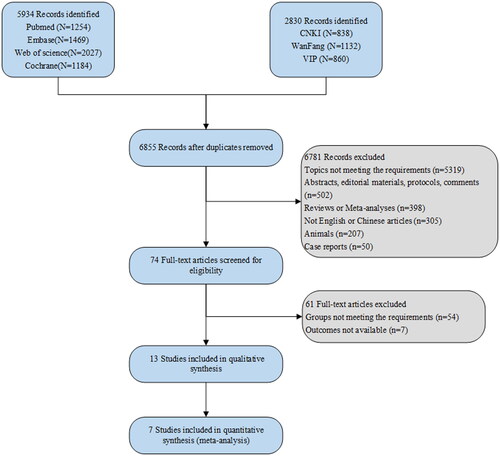
Table 1. Baseline characteristics of the included studies.
Table 2. Newcastle-Ottawa Quality assessment scale for cohort studies.
Table 3. Newcastle-Ottawa Quality assessment scale for case-control studies.
Figure 2. Dose-response association between GI and the risk of GDM GI, glycemic index.
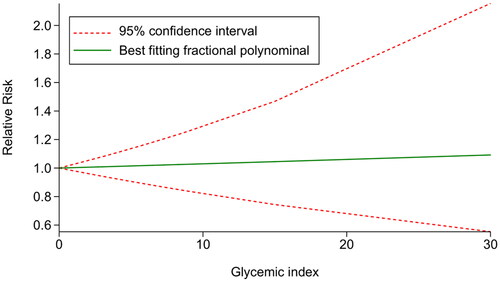
Figure 3. Dose-response association between GI and the risk of GDM after covariate adjustment GI, glycemic index.
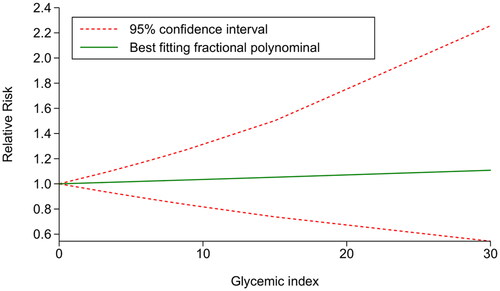
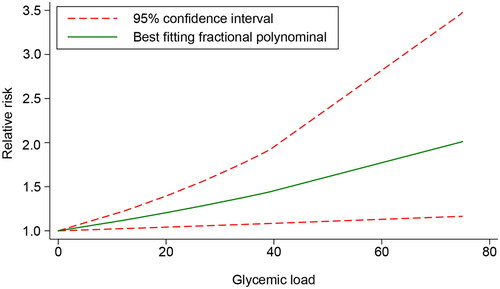
Figure 4. Dose-response association between GL and the risk of GDM GL, glycemic load.
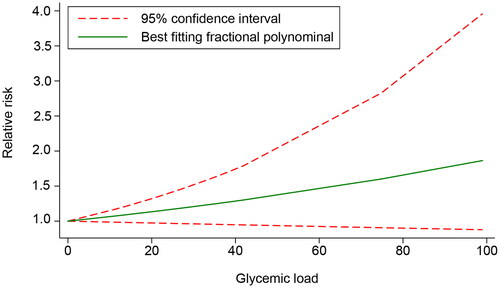
Figure 5. Dose-response association between GL and the risk of GDM after covariate adjustment GL, glycemic load.
Data availability statement
The datasets used and/or analyzed during the current study are available from the corresponding author on reasonable request.