Figures & data
Figure 1. Continuum of discursive violence.

Figure 2. Fairclough’s (Citation1992, Citation2010) dimensions of discourse. Note. Fairclough's (Citation1992, Citation2010) dimensions of discourse (labeled within the boxes) and the respective dimensions of discourse analysis (labeled to the right of the boxes).
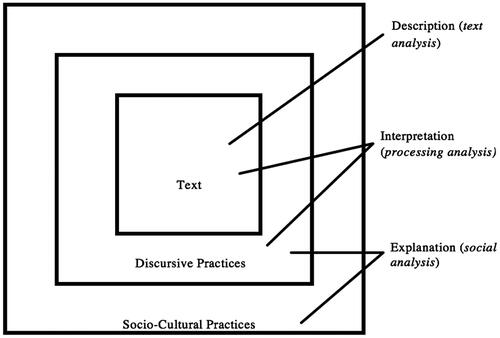
Figure 3. Three-dimensional framework of discursive violence.
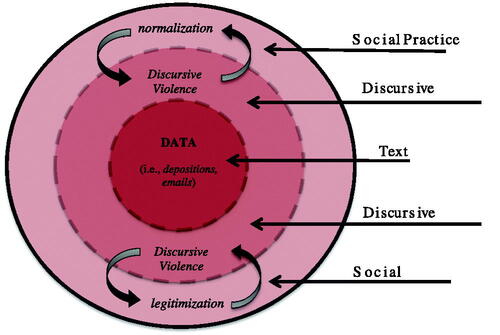
Table 1. Data produced during court discovery.
Table 2. Nodes coded across each construct and data.
Figure 4. Enrollment comparison of DCPS and D.C. Public Charter Schools.
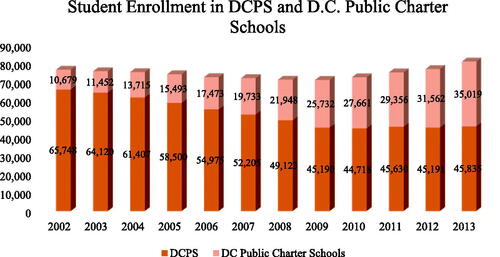
Figure 5. Email exchange between concerned parent and administrators regarding the misleading of the IFF Study.
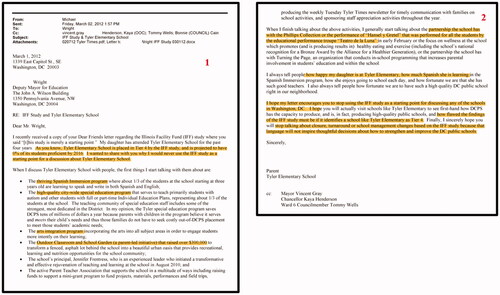
Figure 6. Confidential email from the DCPS Chief of Data and Strategy regarding data compilation by ERS and IFF.
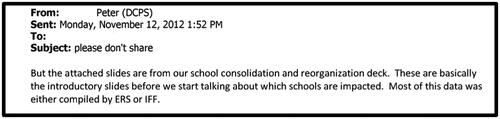
Figure 7. Email from the DCPS chief of data and strategy reiterating the use of the studies.

Figure 8. Email exchange from the DCPS Deputy Chancellor of operations to the DCPS chancellor regarding the recommendations of the United States Department of Education.
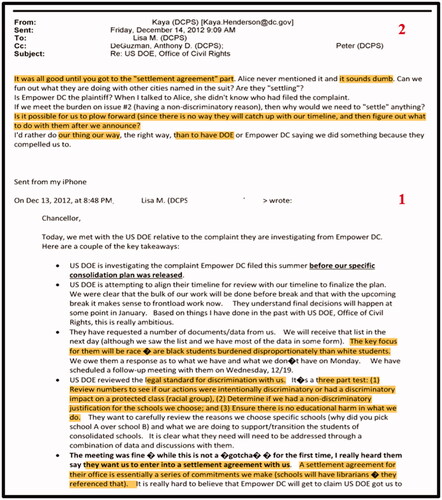
Figure 9. Email exchange from the DCPS Chief of Data and Strategy and the DCPS Chancellor clarifying the school closure timeline.
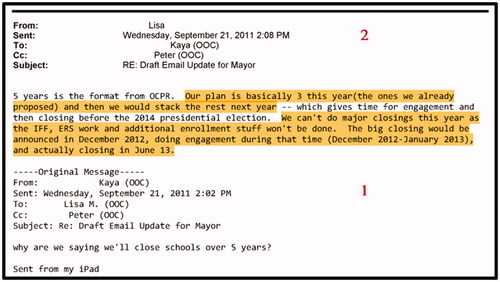
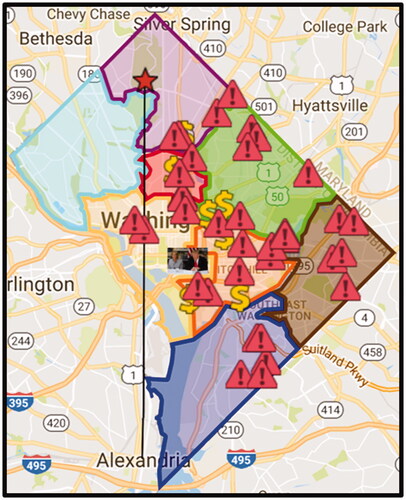
Figure 10. Map of Washington, D.C. Wards. Note. Map of Washington, D.C., wards, with an overlay of all locations of the 2008 and 2013 school closures. Yellow dollar symbols represent the areas of gentrification.