Figures & data
Figure 1. ROC plot showing the relationship between ‘Hit rate’ and ‘False alarm rate’ of click train detections by the three C-POD filters compared to the Pamguard filter based on the whole data-set (42 days). The figure to the right is zoomed in to show details at false alarm rates below 0.05. Points represent rates calculated from the actual detections. Curves are corresponding iso-detectability curves under the assumption that the underlying distributions are Gaussian and of equal variance. See text for further explanation.
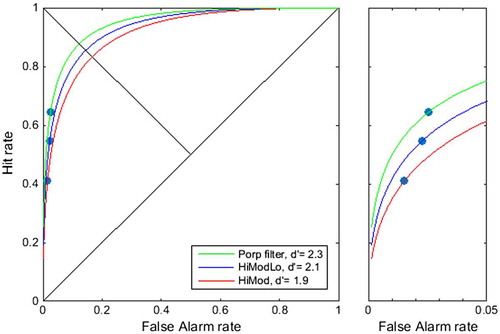
Figure 2. Per cent of time where the four filters detected porpoise positive minutes (PPM) under different noise levels based on 42 days of data. Broadband noise levels in the range 20 kHz–160 kHz were grouped in 1 dB intervals.
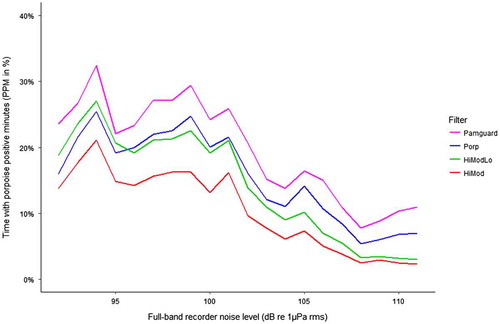
Figure 3. Performance of the three C-POD filters’ ability to register porpoise positive minutes (PPM) at different noise levels relative to what was detected by the Pamguard filter based on 42 days of data. Error bars indicate the 95 % confidence interval. (A) Noise level from full-band recorder; (B) Noise level from C-POD (Nall).
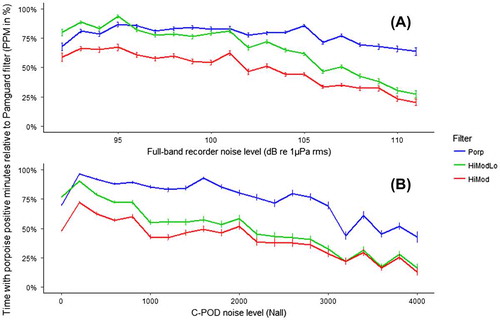
Figure 4. Scatter plot showing the relationship between the unfiltered signals recorded on the C-PODs (Nall) and the broadband noise level from full-bandwidth loggers in the frequency range 20 kHz–160 kHz for the whole period. Saturated recordings on the C-PODs with a Nall value of 4095 were excluded from the analysis. There is a negative binomial correlation between the Nall and broad band noise level (p < 0.01 %).
Figure 5. Line plot showing the characteristics of ambient noise recorded at the two stations during the whole period. Ambient noise level is shown as the sound power spectrum density level (dB re 1 µPa2/Hz) at frequencies between 25 Hz and 160 kHz. Percentiles are plotted to illustrate the variance of the noise level (L5, L25, L50, L75 and L95).