Figures & data
Table 1. Number of tokens produced by female and male expressers per context for raw and final datasets.
Figure 1. The analysis framework followed three main steps: 1) extraction of acoustic features from human and chimpanzee vocalisations that were produced in 10 matching behavioural contexts; 2) pre-processing of the audio data, and 3) testing acoustic differentiability of vocalisations for specific contexts between species using two techniques; vocalisations produced in specific contexts were identified as acoustically similar between the two species if verified by both methods.
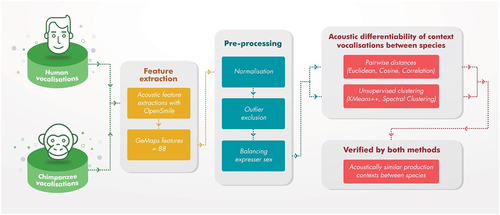
Figure 2. Acoustic characteristics of human and chimp vocalisations in the final dataset. Larger circles signify higher values. Min. = minimum, max. = maximum, SCoG = Spectral centre of gravity, dB = decibel, Hz = Hertz, sec = seconds.
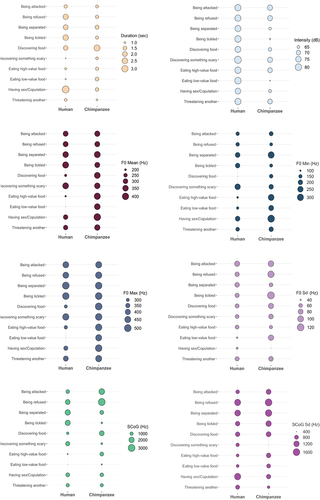
Figure 3. Acoustic similarity evaluations. (a) pairwise Euclidean distance. Warmer (red) colours indicate smaller distance (i.e. greater similarity), and colder (blue) colours indicate larger distance (i.e. low similarity); (b) unsupervised clustering quality assessed by Adjusted Rand Index. Darker colours indicate better separability. In both measures, boxes with black borders show similar vocalisations produced in similar contexts by the two species.
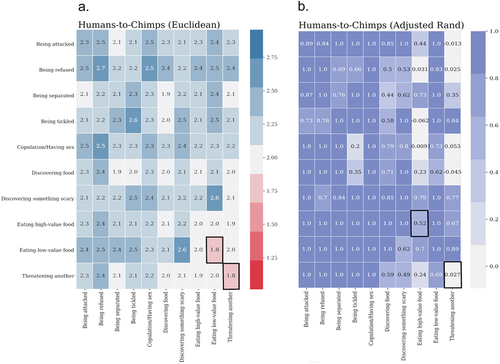
Figure 4. (Continued).
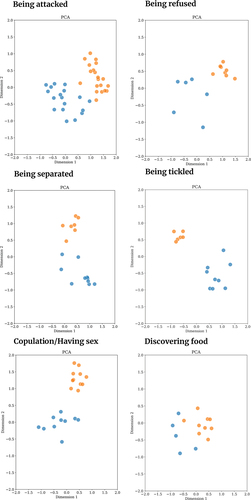
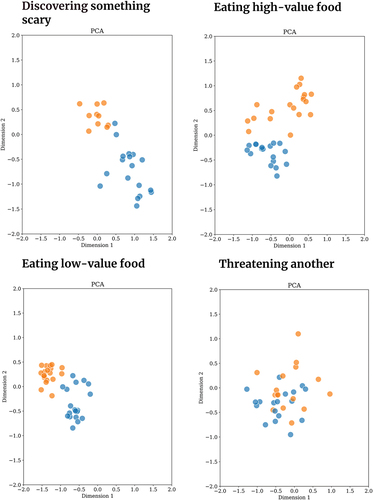
Figure 4. 2D acoustic maps of human and chimpanzee vocalisations produced while threatening another individual, constructed using Principal Component analysis (PCA). Blue data points are human vocalisations, orange data points are chimpanzee vocalisations. Vocalisations produced in threatening another context are acoustically similar between the two species. This similarity is illustrated with two other dimension reduction techniques (Spectral Embedding and t-SNE) with 2D acoustic maps (see Supplementary Materials Figure S6).