2,748
Views
9
CrossRef citations to date
0
Altmetric
Original Articles

The effect of P2Y12 inhibition on platelet activation assessed with aggregation- and flow cytometry-based assays

, , , , ORCID Icon, , , , , , & show all
Pages 567-575 | Received 17 Jun 2016, Accepted 03 Oct 2016, Published online: 25 Nov 2016

Figures & data

Figure 1. Fibrinogen binding after stimulation in the presence of P2Y12 antagonists. (A) Light transmission aggregation was recorded after stimulation with high and low concentrations of ADP, PAR-1 and PAR-4 agonist, and CRP-xl in the presence and absence of cangrelor (AR-C) in four healthy donors. Mean and standard error of mean are shown for the final amplitude of aggregation after 14 min. (B) Representative aggregation traces. (C) Platelets were stimulated with increasing concentrations of ADP, PAR-1, PAR-4 agonist, or CRP-xl in presence of cangrelor (dark gray), apyrase (light gray) or buffer only (black) and fibrinogen binding was analyzed with flow cytometry as a measure of αIIbβ3 activation. Area under the curve of αIIbβ3 activation in presence of cangrelor or apyrase is expressed as a percentage of mock-treated platelets. Mean and standard error of the mean are shown. Measurements were performed in five healthy donors (*p < 0.05).
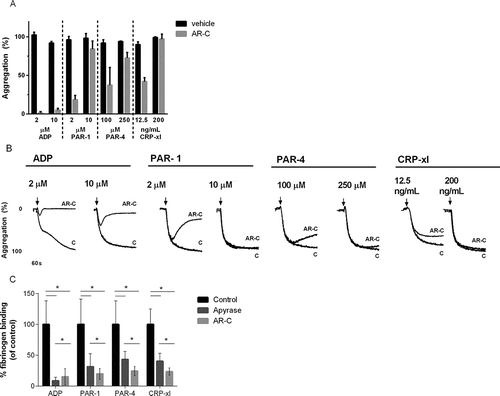
Figure 1. Fibrinogen binding after stimulation in the presence of P2Y12 antagonists. (A) Light transmission aggregation was recorded after stimulation with high and low concentrations of ADP, PAR-1 and PAR-4 agonist, and CRP-xl in the presence and absence of cangrelor (AR-C) in four healthy donors. Mean and standard error of mean are shown for the final amplitude of aggregation after 14 min. (B) Representative aggregation traces. (C) Platelets were stimulated with increasing concentrations of ADP, PAR-1, PAR-4 agonist, or CRP-xl in presence of cangrelor (dark gray), apyrase (light gray) or buffer only (black) and fibrinogen binding was analyzed with flow cytometry as a measure of αIIbβ3 activation. Area under the curve of αIIbβ3 activation in presence of cangrelor or apyrase is expressed as a percentage of mock-treated platelets. Mean and standard error of the mean are shown. Measurements were performed in five healthy donors (*p < 0.05).

Figure 2. Alpha-granule release after stimulation in the presence of P2Y12 antagonists. Platelets were stimulated with increasing concentrations of ADP, PAR-1, PAR-4 agonist, or CRP-xl in presence of cangrelor (AR-C) (dark gray), apyrase (light gray) or buffer only (black), and P-selectin expression was analyzed with flow cytometry as a measure of granule secretion. (A) Area under the curve of P-selectin expression in the presence of cangrelor or apyrase is expressed as a percentage of mock-treated platelets. Mean and standard error of the mean are shown. Measurements were performed in five healthy donors. (B) Platelets were activated with PAR-1 agonist with or without cangrelor and concentrations of RANTES, (C) platelet factor 4 (PF-4), (D) β-thromboglobulin (β-TG), and (E) PDGF-A/B were determined with ELISA. Data are expressed as mean ± SEM (*p < 0.05).
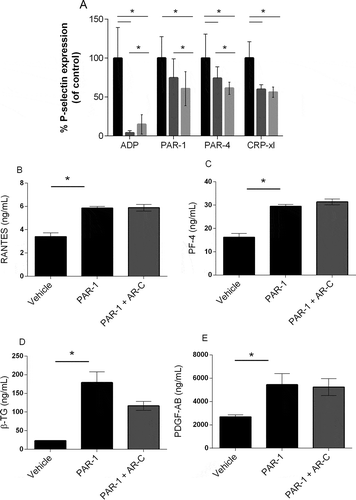
Figure 2. Alpha-granule release after stimulation in the presence of P2Y12 antagonists. Platelets were stimulated with increasing concentrations of ADP, PAR-1, PAR-4 agonist, or CRP-xl in presence of cangrelor (AR-C) (dark gray), apyrase (light gray) or buffer only (black), and P-selectin expression was analyzed with flow cytometry as a measure of granule secretion. (A) Area under the curve of P-selectin expression in the presence of cangrelor or apyrase is expressed as a percentage of mock-treated platelets. Mean and standard error of the mean are shown. Measurements were performed in five healthy donors. (B) Platelets were activated with PAR-1 agonist with or without cangrelor and concentrations of RANTES, (C) platelet factor 4 (PF-4), (D) β-thromboglobulin (β-TG), and (E) PDGF-A/B were determined with ELISA. Data are expressed as mean ± SEM (*p < 0.05).

Figure 3. Dense granule release after stimulation in the presence of P2Y12 antagonists. Platelets were stimulated with increasing concentrations of ADP, PAR-1, PAR-4 agonist or CRP-xl in presence of cangrelor (dark gray), apyrase (light gray) or buffer only (black), and CD63 expression was analyzed with flow cytometry as a measure of dense granule secretion. (A) Area under the curve of CD63 expression in the presence of cangrelor or apyrase are expressed as a percentage of mock-treated platelets. Mean and standard error of the mean are shown. Measurements were performed in five healthy donors. ATP release (B, D) and ADP release (C, E) was measured in healthy donors (n = 4) in the presence and absence of cangrelor and in blood of three patients on P2Y12 inhibitors after stimulation with PAR-1 agonist (B, C) and CRP-xl (3D, E). Data are expressed as mean ± SEM (*p < 0.05).
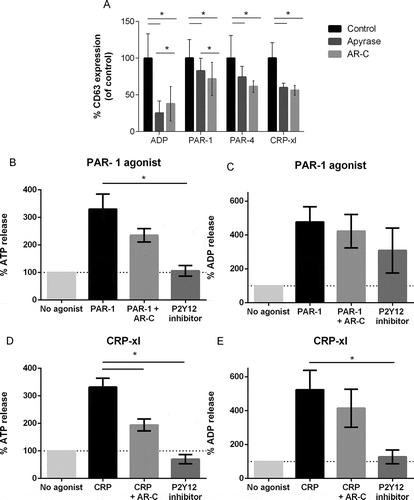
Figure 3. Dense granule release after stimulation in the presence of P2Y12 antagonists. Platelets were stimulated with increasing concentrations of ADP, PAR-1, PAR-4 agonist or CRP-xl in presence of cangrelor (dark gray), apyrase (light gray) or buffer only (black), and CD63 expression was analyzed with flow cytometry as a measure of dense granule secretion. (A) Area under the curve of CD63 expression in the presence of cangrelor or apyrase are expressed as a percentage of mock-treated platelets. Mean and standard error of the mean are shown. Measurements were performed in five healthy donors. ATP release (B, D) and ADP release (C, E) was measured in healthy donors (n = 4) in the presence and absence of cangrelor and in blood of three patients on P2Y12 inhibitors after stimulation with PAR-1 agonist (B, C) and CRP-xl (3D, E). Data are expressed as mean ± SEM (*p < 0.05).

Table I. Characteristics and test results of anonymous patients on P2Y12 inhibitors.

Figure 4. Platelet reactivity testing in patients on P2Y12 inhibitors. Inhibition of αIIbβ3 activation and P-selectin expression measured in 72 patients on P2Y12 inhibitors, normalized against the response in 43 healthy donors. Black symbols represent responders to P2Y12 inhibitors according to the VerifyNow P2Y12 assay (based on cut-off PRU < 208) and gray symbols represent nonresponders. (A) Platelets were stimulated with 31.25 µM ADP, (B) 100 µM PAR-1 agonist, or (C) 1000 ng/mL CRP-xl (5c). The dotted lines represent the lowest 2.5th percentile of fibrinogen binding and P-selectin expression of the healthy donors. (D) Percentage comparison of fibrinogen binding after stimulation with ADP, PAR-1 agonist, or CRP-xl between healthy donors (controls), responders to P2Y12 inhibition and nonresponders (*p < 0.05).
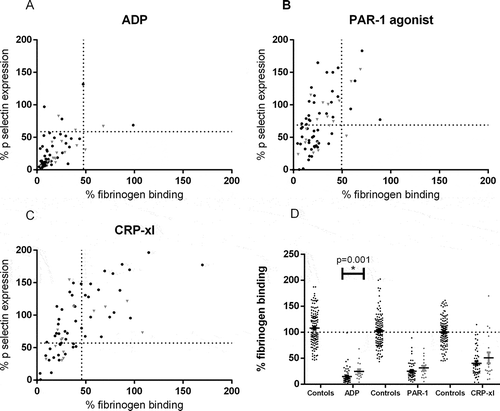
Figure 4. Platelet reactivity testing in patients on P2Y12 inhibitors. Inhibition of αIIbβ3 activation and P-selectin expression measured in 72 patients on P2Y12 inhibitors, normalized against the response in 43 healthy donors. Black symbols represent responders to P2Y12 inhibitors according to the VerifyNow P2Y12 assay (based on cut-off PRU < 208) and gray symbols represent nonresponders. (A) Platelets were stimulated with 31.25 µM ADP, (B) 100 µM PAR-1 agonist, or (C) 1000 ng/mL CRP-xl (5c). The dotted lines represent the lowest 2.5th percentile of fibrinogen binding and P-selectin expression of the healthy donors. (D) Percentage comparison of fibrinogen binding after stimulation with ADP, PAR-1 agonist, or CRP-xl between healthy donors (controls), responders to P2Y12 inhibition and nonresponders (*p < 0.05).
Supplemental material

Leunissen et al Supp Figure

Download PDF (107.1 KB)