4,476
Views
22
CrossRef citations to date
0
Altmetric
Special Review: Platelets On Aggregometry

96-well plate-based aggregometry

ORCID Icon, &
Pages 650-655 | Received 21 Nov 2017, Accepted 13 Feb 2018, Published online: 15 Mar 2018

Figures & data

Figure 1. A schematic of (A) traditional light transmission aggregometry (LTA) in the (i) absence and (ii) presence of a platelet agonist as measured by light transmission. When a platelet agonist is added, an aggregate forms and increased transmission of light is detected giving high % aggregation. (B) 96-well plate aggregometry with decreasing concentrations of agonist from left to right. In a plate reader, light absorbance is detected. When an aggregate is formed, less light is absorbed, giving high % aggregation. Conversely, when a low concentration of agonist is added, more light is absorbed, leading to low % aggregation. C) The layout of an Optimul plate with seven concentrations of the platelet agonists AA, ADP, collagen, epinephrine, ristocetin, TRAP-6 amide and U46619 lyophilized onto the plate. % aggregation is determined by control PRP and PPP wells and measured by absorbance in a plate reader. This figure was produced using Servier Medical Art (http://www.servier.com).
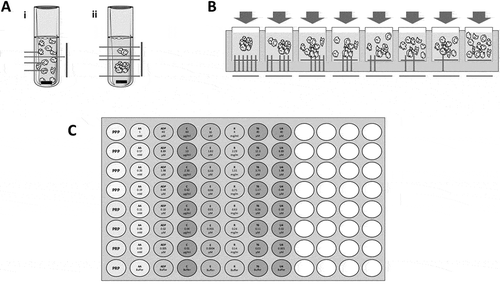
Figure 1. A schematic of (A) traditional light transmission aggregometry (LTA) in the (i) absence and (ii) presence of a platelet agonist as measured by light transmission. When a platelet agonist is added, an aggregate forms and increased transmission of light is detected giving high % aggregation. (B) 96-well plate aggregometry with decreasing concentrations of agonist from left to right. In a plate reader, light absorbance is detected. When an aggregate is formed, less light is absorbed, giving high % aggregation. Conversely, when a low concentration of agonist is added, more light is absorbed, leading to low % aggregation. C) The layout of an Optimul plate with seven concentrations of the platelet agonists AA, ADP, collagen, epinephrine, ristocetin, TRAP-6 amide and U46619 lyophilized onto the plate. % aggregation is determined by control PRP and PPP wells and measured by absorbance in a plate reader. This figure was produced using Servier Medical Art (http://www.servier.com).

Figure 2. Concentration–response curves of platelet aggregation in response to: AA (0.03–1 mM), ADP (0.005–40 μM), collagen (0.01–40 μg/ml), epinephrine (0.0004–10 μM), ristocetin (0.14–4 mg/ml), TRAP-6 amide (0.03–40 μM) and U46619 (0.005–40 μM) on Optimul plates after 5 minutes of mixing (1200 rpm) at 37°C. Data are shown as mean ± SEM, n = 6. Adapted from Chan et al. (Citation18).
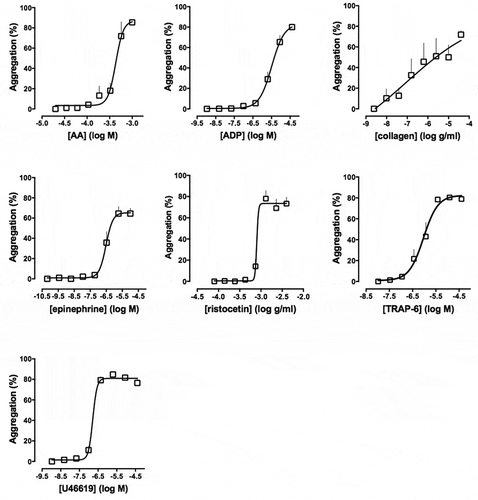
Figure 2. Concentration–response curves of platelet aggregation in response to: AA (0.03–1 mM), ADP (0.005–40 μM), collagen (0.01–40 μg/ml), epinephrine (0.0004–10 μM), ristocetin (0.14–4 mg/ml), TRAP-6 amide (0.03–40 μM) and U46619 (0.005–40 μM) on Optimul plates after 5 minutes of mixing (1200 rpm) at 37°C. Data are shown as mean ± SEM, n = 6. Adapted from Chan et al. (Citation18).