Figures & data
Figure 1. Procedure using immunodeficiency mice.
Mice after 14 day-administration of eltrombopag were designated as eltro-mice. Mice maintained for 2–3 months after the 14-day administration were designated as steady-state-mice. Mice that were transplanted with human CD34-positive cells without eltrombopag, were designated as control-mice.
Figure 2. FCM analysis of peripheral blood samples obtained from eltro-mice and steady-state-mice.
Peripheral blood was obtained from eltro-mice (A and B) or steady-state-mice (C and D). The blood samples were double-stained with FITC-conjugated human CD41 (right of panels) or negative (left of A and C) antibody as well as a Sysmex exclusive reagent of the XN series. FSC intensity is shown on the horizontal axis and FITC intensity is shown on the vertical axis (A and C). FITC-positive (red) and -negative (blue) platelets were gated in the right panels of A and C, and represented in B or D. The intensity of the Sysmex exclusive reagent is shown on the horizontal axis and FSC intensity is shown on the vertical axis (B and D). For the analysis of positive particles in B and D, we set the gate where no positive particles were detected without the Sysmex exclusive reagent (F).The numbers in red in A and C represent human platelets as a percentage of the total number of observed platelets. The numbers indicated in B and D represent the geometric mean of specific reagent intensities of red or blue dots, and representative data are shown (n ≧ 4). IPF% of human platelets were estimated (black letters in left of panels B and D). The geometric mean of specific reagent intensity for human platelets/geometric mean for mouse platelet ratios are described as the dotplots. The average are shown as lines (n ≥ 4) (E). **p < 0.01.
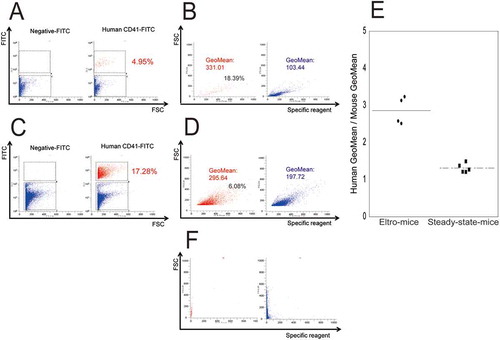
Figure 3. XN analysis of the peripheral blood samples.
Peripheral blood samples were obtained from eltro-mice or control-mice, and were analyzed using the XN series. Representative PLT-F scattergram from the XN-series is shown (A and B). Red circles indicate IPF area. The values of IPF% are shown as the dotplots. The average are shown as lines (n = 4–6) (C). **p < 0.01.
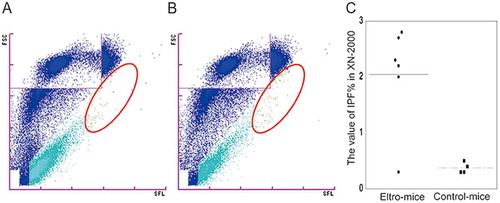
Figure 4. SEM observation of human CD41-positive platelets.
Human CD41-positive cells were isolated from the PRP from eltro-mice (A) or steady-state-mice (B). Representative magnetic bead-attached human CD41-positive platelets are shown. The values of areas from the SEM images are shown as the dotplots. The average are shown as lines (n = 15–17) (C). Scale Bar = 1 μm. White arrows in A and B indicate magnetic beads.
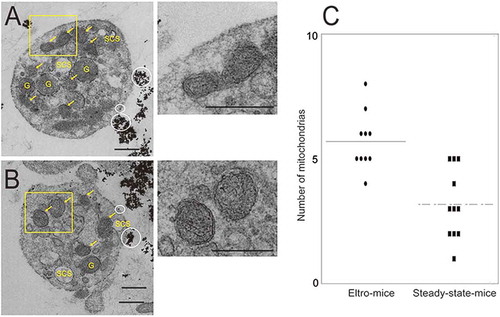
Figure 5. TEM observation of human CD41-positive platelets.
Human CD41-positive cells were isolated from the PRP from eltro-mice (A) or steady-state-mice (B). Representative magnetic bead-attached human CD41-positive platelets are shown. The numbers of mitochondria in each platelet observed with TEM are shown as the dotplots. The average are shown as lines (n = 10–11) (C). Scale Bar = 1 μm. White circles in A and B indicate magnetic beads. Yellow arrows indicate mitochondria. G: granules, SCS: surface connecting systems. Right panels of A and B are high magnification images of yellow rectangles. ***p < 0.001.