Figures & data
Table I. The streamlined panel of agonists used for lumi-aggregometry in diagnosing platelet function defects in 175 women with HMB. ATP secretion from dense granules was measured with ADP 30 µM, adrenaline 10 µM, arachidonic acid 1 mM, PAR1 – specific peptide 100 µM and collagen 3 µg/ml.
Table II. Typical lumi-aggregometry findings in the commonly encountered platelet defects within the HMB cohort.
Figure 1. Spread of ages for all recruited patients.
A scatter dot plot showing the spread of ages of all recruited patients in this study. The patients age was available for 22 healthy controls and 154 HMB patients. Horizontal bars indicate median and interquartile range. Statistical analysis was performed using parametric unpaired t-test, statistically significant difference is denoted by **** P < 0.0001.
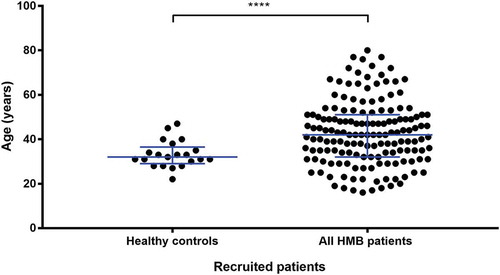
Table III. Phenotypic symptoms of 175 patients recruited to the UK-GAPP study with HMB of unknown aetiology. Types of bleeding symptoms were assessed using the ISTH-BAT and the percentage of patients suffering from a platelet defect or no platelet defect using lumiaggregometry are listed. Statistical analysis was performed using ordinary two-way ANOVA with Sidak’s multiple comparisons test. P-values are listed, no statistical significance was noted (P ≥ 0.05).
Figure 2. The relationship between presence of a platelet function defect detected by lumiaggregometry and the ISTH-BAT score.
A scatter dot plot showing the spread of ISTH-BAT scores in the healthy controls (n = 22), no platelet defect (n = 89) and platelet defect (n = 82) groups. Horizontal bars indicate median and interquartile range. Statistical analysis was performed using the non-parametric Kruskal-Wallis test and Dunn’s adjustment for multiple comparisons, the mean rank of each column was compared with the mean rank of every other column. Statistically significant difference is denoted by **** = P < 0.0001. No statistical significance (P = 0.46) was seen between the no platelet defect and platelet defect group.
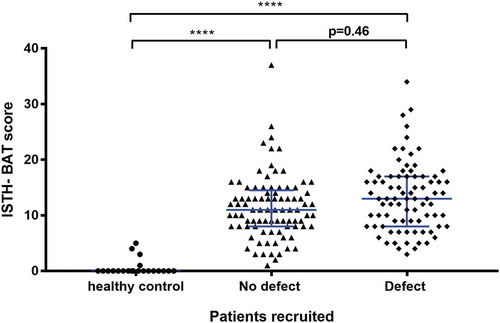
Figure 3. The relationship between the type of platelet defect identified by lumiaggregometry and the ISTH-BAT score.
A scatter dot plot showing the spread of ISTH-BAT scores between the platelet defects identified on lumiaggregometry, healthy controls (n = 21), No defect (n = 88), defect (n = 75) of which; cyclooxygenase defect (n = 7), Gi receptor signalling defect (Gi defect) (n = 14), Secretion defect (n = 13), thrombocytopenia (n = 25), ADP receptor defect (n = 3) and other (n = 13). Horizontal bars indicate median and interquartile range. Statistical analysis was performed using non-parametric Kruskal-Wallis and Dunn’s multiple comparisons test, the mean rank of each column was compared with the mean rank of every other column. Statistically significant difference is denoted by * = P < 0.05, **** = P < 0.0001, no statistically significant difference (P > 0.05) was observed between the platelet defect subgroups.
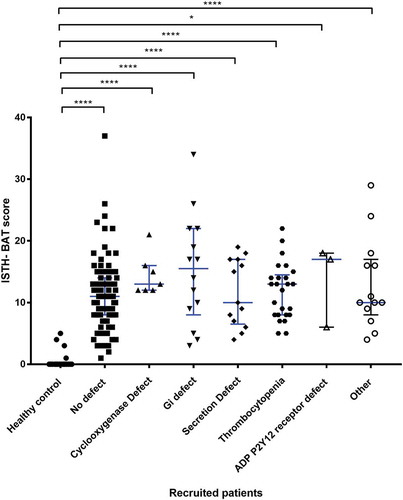
Figure 4. The type of platelet defect identified in the HMB group as defined by lumiaggregometry.
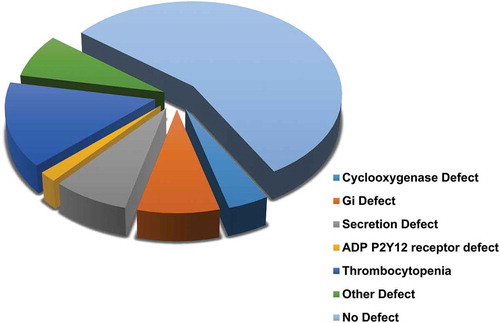
Figure 5. Comparison of PLT-F between types of platelet defect groups identified by lumiaggregometry. A scatter dot plot showing the spread of PLT-F results between the recruited patients. Healthy controls (n = 43), all HMB patients (n = 103), No defect (n = 61), and defect (n = 42). Error bars represent mean ± 1 SD. Statistical analysis was performed using parametric ordinary one-way ANOVA with Tukey multiple comparisons test, the mean rank of each column was compared with the mean rank of every other column. Statistically significant difference is denoted by * = P ≤ 0.05, *** = P ≤ 0.001.
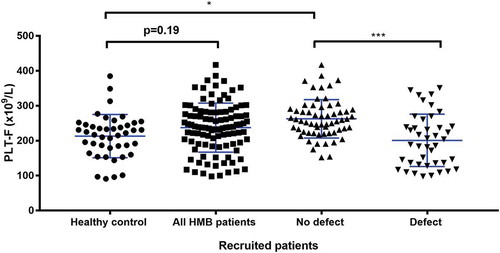
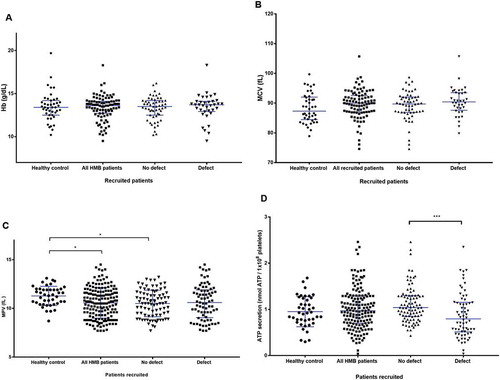
Figure 6. Other haematological and platelet function testing findings between the groups of patients in the study. (A) Comparison of haemoglobin between healthy volunteers and recruited patients with and without a platelet defect. A scatter dot plot showing the spread of Hb results between the recruits. Healthy controls (n = 43), all HMB patients (n = 92), no defect (n = 56), and defect (n = 36). Horizontal bars indicate median and interquartile range. Statistical analysis was performed using non-parametric Kruskal-Wallis and Dunn’s multiple comparisons test, the mean rank of each column was compared with the mean rank of every other column. Comparison between pairs of groups was not significant (P >0.05) for all data points. (B) Comparison of MCV parameters between the healthy control and recruited patients with and without a platelet defect. A scatter dot plot showing the spread of MCV results between the recruits. Healthy controls (n = 42), all recruited HMB patients (n = 92), No defect (n =56) and, defect (n = 36). Horizontal bars indicate median and interquartile range. Statistical analysis was performed using non-parametric Kruskal-Wallis and Dunn’s multiple comparisons test, the mean rank of each column was compared with the mean rank of every other column. Comparison between pairs of groups was not significant (P ≥ 0.05) for all data points. (C) Comparison of MPV parameters between types of platelet defects identifiedvia lumiaggregometry. A scatter dot plot showing the spread of MPV results between the recruits. Healthy controls (n = 43), all HMB patients (n = 162), No defect (n = 86), and defect (n = 76). Horizontal bars indicate median and interquartile range. Statistical analysis performed using the non-parametric Kruskal-Wallis test and Dunn’s adjustment for multiple comparisons, the mean rank of each column was compared with the mean rank of every othercolumn. Statistically significant difference is denoted by * = P ≤ 0.05. (D) Comparison of ATP-secretion between types of platelet defects identified by lumiaggregometry. Scatter dot plot showing the spread of ATP secretion results between the recruited patients. Healthy controls (n = 42), all HMB patients (n = 155), no defect (n = 89), and defect (n = 66). Horizontal bars indicate median and interquartile range. Statistical analysis was performed using non-parametric Kruskal-Wallis and Dunn’s multiple comparisons test, the mean rank of each column was compared with the mean rank of every other column. Statistically significant difference is denoted by *** = P ≤ 0.001.