Figures & data
Figure 1. Overall design of the WILL lOWer dose aspirin be more effective in ACS? (WILLOW ACS) study. ACS, acute coronary syndrome; BD, twice daily; mg, milligrams; OD, once daily; R, point of randomization.
Table I. Baseline demographics of the 20 randomized patients.
Table II. Comparison of study medication period duration, sampling times and compliance between the 20 mg BD and 75 mg OD aspirin regimens. Values are shown as mean ± SD and p values were generated by paired t-tests.
Table III. Results of analyses of pharmacodynamic endpoints during each aspirin dosing regimen at steady state. Values shown are mean ± SD. p values were generated from paired t-tests.
Figure 2. Serum TXB2 (a) and bleeding time (b) in ACS patients receiving two regimens of aspirin and ticagrelor in the WILLOW ACS study. Bars represent mean + SD. Dots and lines represent paired values for the individual participants. p values shown were generated by paired t-tests between the groups (see text and tables for further details). BD, twice-daily; OD, once-daily s, seconds; sTXB2, serum thromboxane B2. the groups (see text and tables for further details). Scale on the y-axis in Figure 2(a) is logarithmic. BD, twice-daily; OD, once-daily s, seconds; TXB2, thromboxane B2.
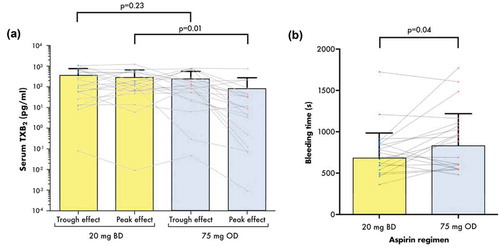
Figure 3. Maximum platelet aggregation responses to arachidonic acid, adenosine diphosphate and collagen assessed by light transmittance aggregometry pre- and post-aspirin dose at the end of each treatment period in the WILLOW ACS study. Bars indicate mean + SD. p values were generated using prespecified paired t-tests. AA, arachidonic acid; ADP, adenosine diphosphate; BD, twice-daily; OD, once-daily.
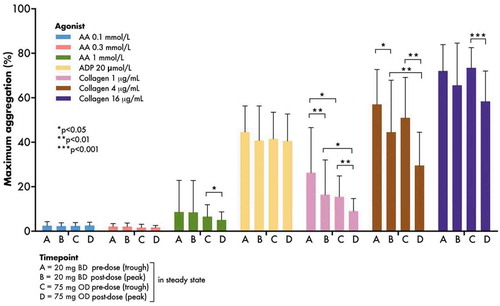
Figure 4. Urinary levels of TX metabolite, PGI2 metabolite 8-iso-PGF2α measured at the end of each treatment period. Bars represent mean + SD. Dots and lines represent paired values for the individual participants. p values shown were generated by paired t-tests between the groups. Scale on the y-axis is logarithmic. 8-iso-PGF2α, 8-iso prostaglandin F2α; BD, twice- daily; PGI-M, prostacyclin metabolite; OD, once-daily; TxM, thromboxane metabolite.
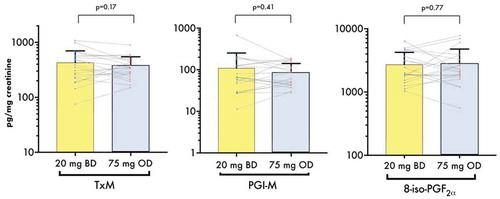
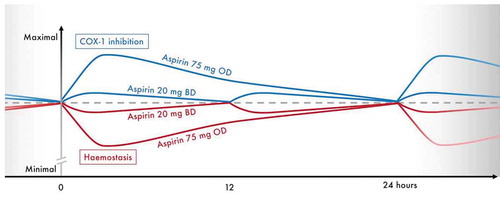
Figure 5. Conceptual figure summarizing the anticipated profiles of COX-1 inhibition and hemostasis provided by maintenance aspirin doses of 75 mg OD or 20 mg BD in combination with ticagrelor 90 mg BD, during steady-state. Figure for illustrative purposes only, scale on the y-axis is arbitrary. Dashed line represents effects on COX-1 and hemostasis at steady-state trough levels. BD, twice-daily; COX-1, cyclo-oxygenase 1; mg, milligrams; OD, once-daily.