
Figures & data
Figure 1. Expression of dre-miR-126a-3p and dre-miR-223-3p in thrombocytes and in a random population of EGFP-negative cells of double-transgenic zebrafish lines compared to control. Results are expressed as fold change relative to control (n = 3, p < .01 using t-test).
Figure 2. Thrombus formation after laser injury of the posterior cardinal vein of different zebrafish lines. A. representative pictures 15 s, 45 s and 2 min after laser injury. White scale bar: 30 µM. B and C. Quantification of thrombocytes at the site of laser injury. Control (n = 16) vs miR-126a/EGFP (n = 13, p < .01 using t-test).
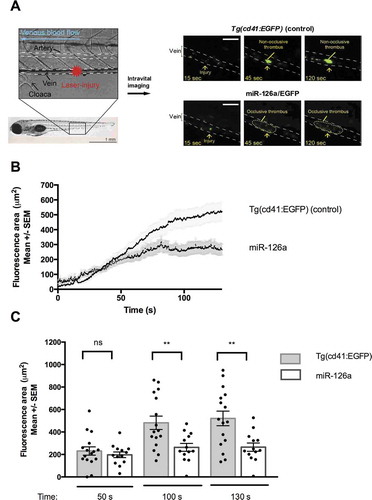
Table I. Effect of selected antithrombotic drugs on vessel occlusion after laser injury in miR-126a/EGFP line. P calculated with Fisher’s exact test.
Figure 3. A. Representative procoagulant PLS by flow cytometry before (left panel) and after (right panel) activation. B. Quantification of procoagulant PLS after activation with thrombin and convulxin. Data are expressed as fold change relative to mock condition (n = 4 independent experiments, p = .012 relative to mock condition and p = .003 relative to scramble using ANOVA followed post-hoc Tukey test).
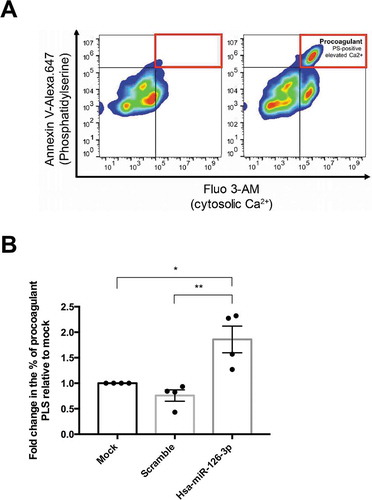
Figure 4. Impact of hsa-miR-126-3p on thrombin generation in human plasma. A. representative thrombin generation profile before (blue) and after (red) cell activation. B. Quantification of the velocity parameter. Data are expressed relative to mock condition (n = 5 independent experiments, p = .016 compared to mock and p = .028 compared to scramble using ANOVA followed post-hoc Tukey test).
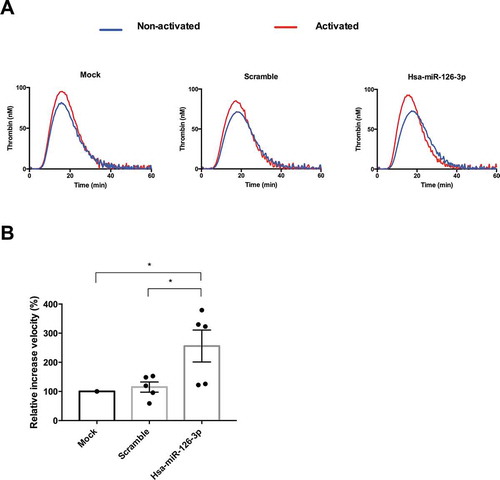
Table II. Correlation of thrombin generation markers and selected miRNA levels in stable cardiovascular patients. F1 + 2: prothrombin fragment 1 + 2. TAT: thrombin-antithrombin complex (Spearman correlation test).