Figures & data
Figure 1. Production of in-house human platelet lysate solutions. A) Production of human platelet lysate (HPL) following different protocols. B) Population doublings per day of fibroblasts grown with 10% FBS, 5% HPL-CM, 5% HPL1, 5% HPL2, 5% HPL3 or 5% HPL4 solutions for 3 passages. Data represent mean ± S.E.M from fibroblasts of 3 different donors. Statistical significance was determined by one-way ANOVA followed by Tukey’s multiple comparison test, *, p ≤ 0.05 and **, p ≤ 0.01. C) All cells expressed fibronectin and collagen type I after culture for 5 passages with 10% FBS, 5% HPL2 or 5% HPL-CM. No significant differences were observed between conditions. Representative confocal images (maximum projections) are shown. Scale bar, 50 µm.
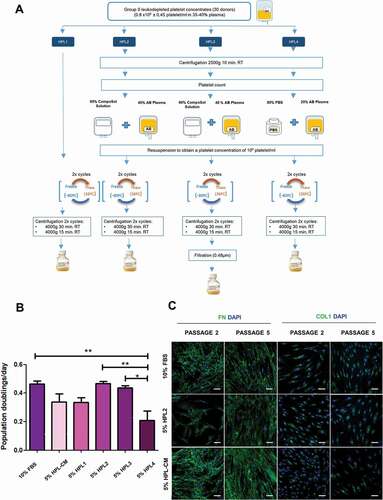
Figure 2. Characterization of fibroblasts grown with different human platelet lysate concentrations. A) Population doubling time and B) number of fibroblasts obtained when cells were grown in 5%, 10% or 15% of HPL2 for at least 3 passages. Data are mean ± S.E.M from fibroblasts of 3 different donors. Statistical significance was determinate by one-way ANOVA test followed by Tukey’s multiple momparison test *, p ≤ 0.05. (C) Immunocytochemsitry analysis for CD13, vimentin (VIM), collagen type I (COL) and fibronectin (FN). Representative confocal images (maximum projections) are shown. Scale bar, 50 µm. D) Flow cytometry analysis showing positivity for CD44, CD90, CD13 and negativity for HLA-DR and CD324 of fibroblasts grown in 5% or 15% HPL2. No significant differences were observed between both supplements (5% and 15%) or with the control group (10% FBS). E) Exponential growth kinetics of fibroblasts (n = 3) grown with different concentrations of HPL2 (5%, 10% and 15%) and 10% FBS. Statistical significance was determinate by two-way ANOVA. No significant differences were observed.
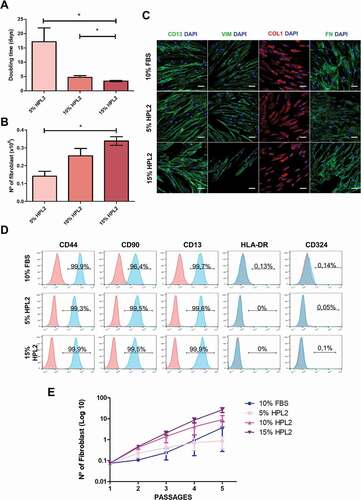
Figure 3. Gene expression profiling of fibroblasts grown with human platelet lysate concentrations. A) Venn diagrams show upregulated (upper panel) and downregulated (bottom panel) differentially expressed genes (DEGs) in fibroblasts cultured with 5% HPL2 versus 10% FBS and with 15% HPL2 versus 10% FBS. B, C) Volcano plots of DEGs at fold change ±2 and FDR p-value ≤0.05. Common DEGs found in both comparison groups (3 upregulated, 17 downregulated) are highlighted in bold. D) Expression levels of characteristic fibroblast markers and other relevant genes (HLA-DR and TF). E) KEGG enriched biological processes of up- and down-regulated DEGs in both comparison groups.
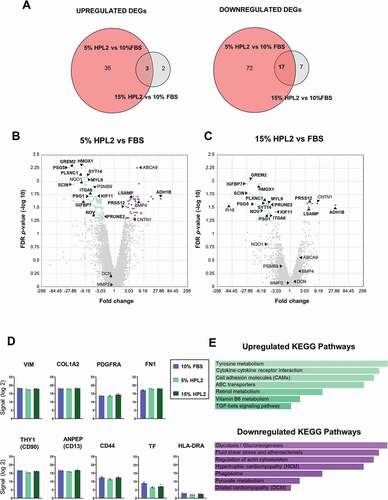
Table I. Quality Controls performed in each batch. The acceptation limit for each release test is indicated in brackets. For the activity test FBS was used as control
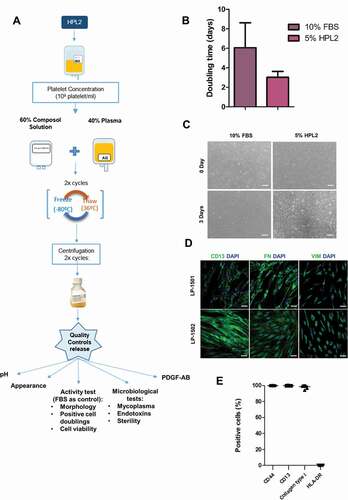
Figure 4. Human platelet lysate GMP validation. A) Scheme of the GMP compliant manufacturing process (production + quality controls) of the HPL2 product. B) Activity test (doubling time of fibroblasts grown in 5% HPL2 versus 10% FBS). Statistical significance was determinated by two-tailed Student´s t-test. No significant differences were observed. C) Morphology of cells grown in the presence of a representative batch of GMP-HPL2. Scale bar, 200 µm. Inmunophenotypic characterization of fibroblasts cultured in 5% HPL2 over 5 passages by immunocytochemistry (D) and flow cytometry (E). All batches were positive for CD13, fibronectin (FN), vimentin (VIM), CD44, collagen type I (COL) and negative for HLA-DR. Data are mean ± S.E.M of 7 batches. Scale bar: 50 µm.