Figures & data
Figure 1. Platelet aggregation and secretion in wild type and Kv1.3−/- mice. (A,D) Representative traces of platelet aggregation in response to (A) 1 µM ADP, and (D) 10 µg/mL CRP-XL (black line, C57BL/6 WT and gray line, Kv1.3−/- (note that the WT and Kv1.3−/- aggregation traces completely overlap in D). (B, E) Mean percent peak aggregation of washed murine platelets in response to ADP (1 and 10 μM, B) and CRP-XL (1 and 10 μg/mL, E) is shown for WT (blue) and Kv1.3−/- (red) mice (mean ± SEM, n = 5). (C, F) Platelet dense granule secretion measured by analysis of ATP release in response to ADP (1 and 10 μM, C) and CRP-XL (1 and 10 μg/mL, F). Values are the mean ± SEM, n = 5; *P < .05, **P < .01, ns = not significant. (G) Representative gel showing the genotyping of C57BL/6 WT, heterozygous, and Kv1.3−/- mice. WT display 337-bp WT band only, Kv1.3−/- display the 495-bp neomycin band only, and heterozygous mice display both bands. The numbers across the bottom of the lanes denote individual samples and controls: bp = base pairs, M = molecular marker, lanes numbered 1–6 contain samples from Kv1.3−/- mice, followed by control samples from wild type (WT), heterozygous (HET) and Kv1.3−/- (KO) mice; BLK = PCR negative control, and M = molecular marker.
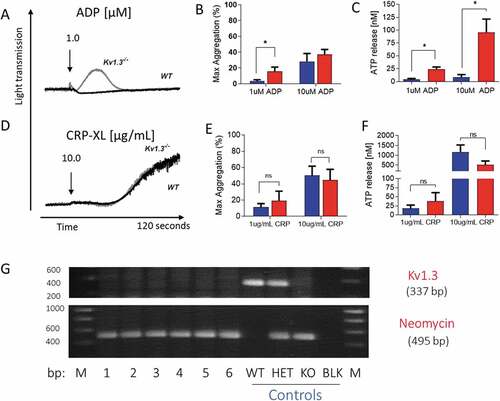
Table I. Platelet surface glycoprotein expression in WT and Kv1.3−/- mice.
Figure 2. Absence of Kv1.3 reduces integrin α2β1-dependent platelet adhesion to collagen. DiOC6-labeled platelets in whole blood from WT or Kv1.3−/- mice were perfused over fibrinogen (200 µg/mL) at a shear rate of 800 s−1 and collagen (100 µg/mL) at 1800 s−1. After 3 minutes of perfusion the coverslips were washed with normal platelet saline, and the images recorded and quantified as described in ‘Methods.’ Representative images (top panel) show platelet adhesion to fibrinogen (Figure 2A) and collagen (Figure 2C). Statistical analysis shows the percent of platelet surface adhesion (mean ± SEM) on fibrinogen (Figure 2B) and collagen (Figure 2D); (n = 5 for fibrinogen and 4 for collagen). DiOC6-labeled platelets in whole blood from WT or Kv1.3−/- mice were also perfused at a shear rate of 1800 s−1 over coverslips coated with synthetic triple-helical peptides specific for the platelet collagen receptors integrin α2β1 (GFOGER, 100 µg/mL) and GPVI (CRP-XL, 100 µg/mL). Representative images (lower panel) show platelet adhesion to (E) peptides VWF-III and GFOGER, and (G) peptides VWF-III and CRP-XL. Scale bar = 20 µm. Statistical analysis shows the mean percent of platelet surface adhesion to (F) VWF-III and GFOGER (n = 5), and (H) VWF-III and CRP-XL (n = 5). (WT, blue; Kv1.3−/-, red). *P < .05, ns = not significant.
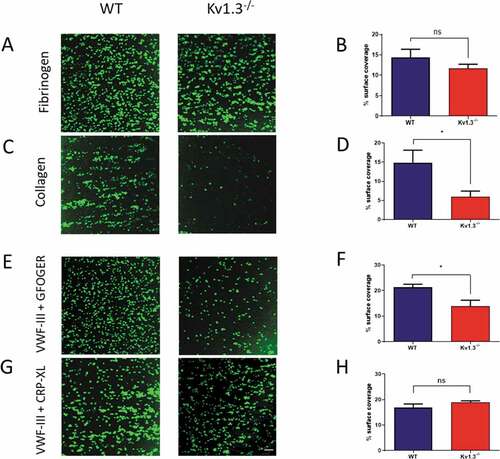
Figure 3. Kv1.3-deficient platelets form fewer and shorter filopodia during integrin α2β1-dependent adhesion. Platelet morphology following perfusion over collagen peptides at a shear rate of 1800 s−1, was classified as ‘round’ (round platelet with no protrusions), ‘filopodia’ (protrusions securing collagen fibrils), ‘ruffled’ (lamellipodia formation), and ‘spread’ (flattened or fried egg appearance). Distribution of platelet morphology following perfusion of WT and Kv1.3−/- platelets over (A) VWF-III and GFOGER (100 µg/mL each peptide), and (D) VWF-III and CRP-XL (100 µg/mL each peptide). Data is expressed as the mean percent of platelets in each category (n = 5). Representative images of WT and Kv1.3−/- platelet morphology on each peptide surface (B) VWF-III and GFOGER, and (E) VWF-III and CRP-XL. Scale bar = 10 µm. (C, F) Data shows the filopodia number per platelet (based on 50 platelets per treatment group), and filopodia length (µm)(based on length of 100 filopodia per treatment group) of WT and Kv1.3−/-platelets adhered to (C) VWF-III and GFOGER, and (F) VWF-III and CRP-XL. *P < .05, ***P < .005.
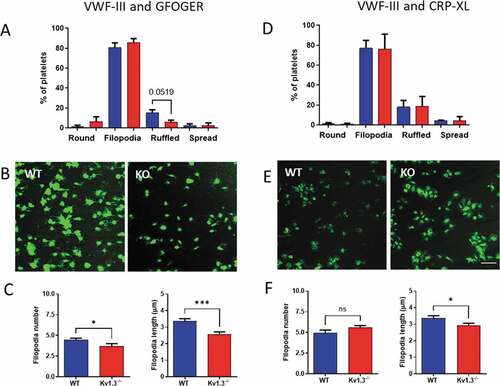
Figure 4. Kv1.3-deficient platelets lack directional persistence during adhesion to collagen via α2β1. The morphology and motile responses of murine platelets labelled with FM®1-43 lipophilic styryl dye (5 µM) were tracked during adhesion to collagen (100 µg/mL) under static conditions. The plotting of co-ordinates tracked the trajectories of WT and Kv1.3-deficient platelets during platelet attachment to the collagen fibers. Platelet movement and direction is measured by displacement (µm) along the x and y axis. Data from 3 independent experiments.
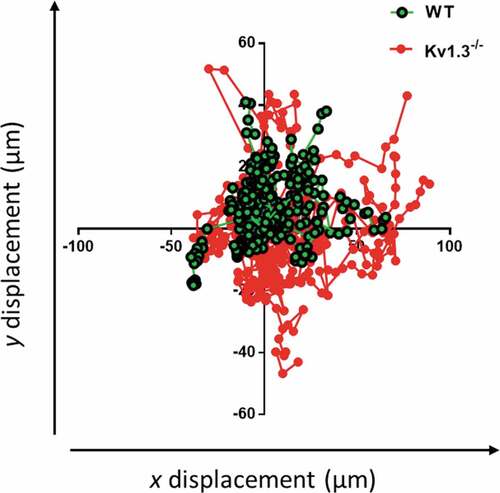
Figure 5. Absence of Kv1.3 reduces in vitro, but not in vivo, thrombus formation. DiOC6-loaded platelets from Kv1.3−/- mice were perfused over collagen-coated coverslips (100 µg/mL), and analyzed for (A) total thrombus volume (µm3) and (B) thrombus height (µm). Data shown is the mean ± SEM for thrombi formed by platelets from WT (blue) and Kv1.3−/- mice (red) (n = 4; *P < .05. (C) Representative side elevation of z-stack fluorescent images of thrombi formed on fibrillar collagen by platelets from WT (upper image) and Kv1.3−/- (lower image) mice. (D) Mean integrated fluorescence (arbitrary units), and (E) Plot of median fluorescence intensity (arbitrary units) over time (seconds), during in vivo thrombus formation following laser-induced injury in cremaster muscle arterioles of WT and Kv1.3−/- mice; (n = 20 thrombi in 5 WT mice and 25 thrombi in 5 Kv1.3−/- mice).
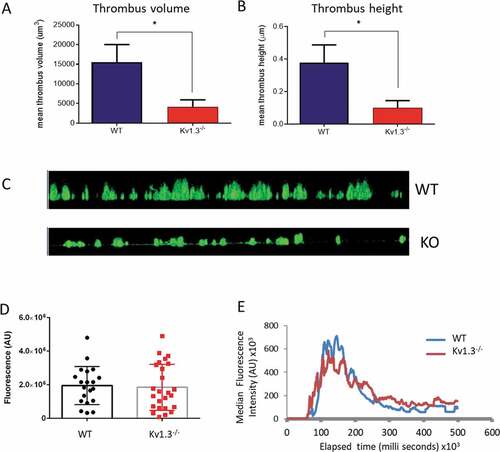
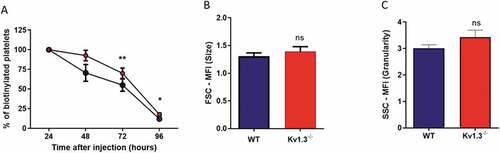
Figure 6. Platelets from Kv1.3−/- display a longer lifespan. (A) Assessment of platelet lifespan was carried out using in vivo biotinylation of murine platelets, recording the percent of biotinylated platelets isolated from WT and Kv1.3−/- mice over five days (n = 4 for each genotype). Flow cytometric analysis of (B) platelet size and (C) platelet granularity gating on forward scatter and side scatter of platelet populations isolated from WT and Kv1.3−/- mice (n = 8). Data shown is mean ±SEM. **P < .01, *P < .05, ns not significant.