
Figures & data
Figure 1. A: Scheme of preparation of EPP by SpinBlood, followed by preparation of PVRP/PPP by SpinEPP. Platelets in PVRP/PPP are represented by white color. B: Flow chart of the two-step centrifugation protocol used to prepare therapeutic plasma for treatment of patients with chronic ear wounds. C-F: Flow cytometry gating strategy. Blood (C, D) and plasma (E, F) are presented as acquired by two settings adapted to the size of analyzed particles (C, E: larger scale and D, F: smaller scale). Smaller scale is indicated by the asterisk. 5 populations of particles were followed – P1: attributed mainly to erythrocytes but containing also leukocytes, P2 and P2* (in larger and in smaller scale settings, respectively): attributed mainly to activated platelets and larger EVs, P3: subpopulation of particles with a weak side scattering signal, and Pa*+Pb*: attributed to smaller EVs and lipoproteins. Colored scale from blue to red corresponds to increasing event density.
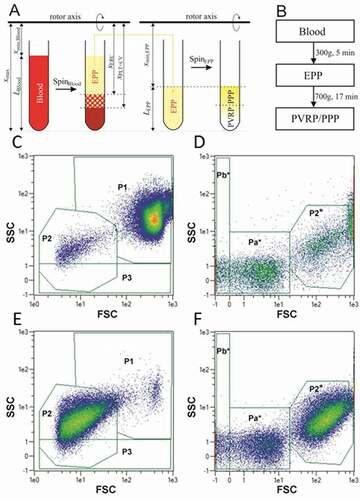
Figure 2. The mechanism of EVs formation from blood cells. A: PVRP showing residual erythrocytes (fat white arrows), leukocytes (white arrows), activated platelets (fat black arrows) and EVs (white triangle is pointing to an example), B: budding platelet (white arrow) and erythrocyte (black arrow) in PVRP, C: smaller magnification image of PVRP, D: pellet after centrifugation of blood at 2000 g showing erythrocyte rouleaux (fat white arrow) and amorphous material probably derived from coalesced platelets (fat black arrow), E: EVs of different shapes including tubular EVs (white arrows) and a deformed fragmenting platelet (fat white arrow) in the isolate. PVRP (Panels A-C) was prepared with the two step protocol [Citation8] (first step: centrifugation of blood for t = 5 min, at CP = 300 g and T = 18°C, second step: centrifugation of EPP for t = 17 min at CP = 700 g and T = 18°C). EPP pellet (Panel D) was prepared by centrifugation for t = 5 min at CP = 2000 g and room temperature. EV isolate (Panel E) was prepared by centrifugation of blood for t = 30 min at CP = 2000 g and 22°C, followed by centrifugation of EPP for 20 min at 17570 g and 22°C with two repeats of washing with PBS and re-centrifugation of the pellet; isolate was visualized in the centrifuge tube in which it was prepared). The images were acquired by JSM-6500 F Field Emission Scanning Electron Microscope (JEOL Ltd., Tokyo, Japan). The figure was assembled by Corel Draw Software (Corel Corporation, Version X6).
![Figure 2. The mechanism of EVs formation from blood cells. A: PVRP showing residual erythrocytes (fat white arrows), leukocytes (white arrows), activated platelets (fat black arrows) and EVs (white triangle is pointing to an example), B: budding platelet (white arrow) and erythrocyte (black arrow) in PVRP, C: smaller magnification image of PVRP, D: pellet after centrifugation of blood at 2000 g showing erythrocyte rouleaux (fat white arrow) and amorphous material probably derived from coalesced platelets (fat black arrow), E: EVs of different shapes including tubular EVs (white arrows) and a deformed fragmenting platelet (fat white arrow) in the isolate. PVRP (Panels A-C) was prepared with the two step protocol [Citation8] (first step: centrifugation of blood for t = 5 min, at CP = 300 g and T = 18°C, second step: centrifugation of EPP for t = 17 min at CP = 700 g and T = 18°C). EPP pellet (Panel D) was prepared by centrifugation for t = 5 min at CP = 2000 g and room temperature. EV isolate (Panel E) was prepared by centrifugation of blood for t = 30 min at CP = 2000 g and 22°C, followed by centrifugation of EPP for 20 min at 17570 g and 22°C with two repeats of washing with PBS and re-centrifugation of the pellet; isolate was visualized in the centrifuge tube in which it was prepared). The images were acquired by JSM-6500 F Field Emission Scanning Electron Microscope (JEOL Ltd., Tokyo, Japan). The figure was assembled by Corel Draw Software (Corel Corporation, Version X6).](/cms/asset/857bda3d-0919-4849-8330-d698146540bc/iplt_a_1961716_f0002_b.gif)
Figure 3. Distribution of particles in plasma above the erythrocyte boundary. A-I: Concentration of particles (A-B: platelets and EVs (P2 particles), C-D: weakly side-scattering particles (P3 particles) and E-F: residual erythrocytes and leukocytes (P1 particles)) measured in layers of EPP (plasma was collected in fractions from the sample surface down to the erythrocyte boundary as indicated in the illustration of the tube). SpinBlood was performed at different CPs as indicated by differently shaded markings of the circles and at different temperatures. The samples were also allowed to sediment in gravitational field (1 g) (empty circles). Concentrations of P1, P2 and P3 particles are given normalized to their blood values (annotated by the dotted line in Panels A-D).
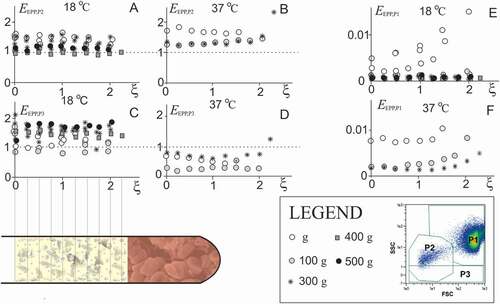
Table I. Average values of parameters relevant for EPP, PVRP and PPP, and correlation coefficients between these parameters with respective probabilities p, calculated by using the results of N samples
Figure 4. The main factors affecting PVRP obtained by a two-step centrifugation protocol. A: Volume of EPP, VEPP, (gathered at 300 g for 5 min) in dependence on erythrocyte sedimentation rate ESR; in theoretical curve (Eq.(2)), ε = 0.13, xmin,Blood = 8 cm and xmax = 14 cm. The saturation level denotes the average of the maximal volume of EPP that could be obtained if the erythrocytes were closely packed in the pellet Vmax,EPP (Eq.(1)). B: Concentration of platelets and EVs (P2 particles) in PVRP in dependence on the distance of the sample level from the rotor axis (xmin)/sedimentation path (LEPP); in the theoretical curve (Eq.(3)), cP2,EPP = 399.109/L and τPLT,EPP = 0.06. C: concentration of P2 particles (empty circles), Pa*+Pb* particles in PVRP (crosses) and Pa*+Pb* particles in PPP (black circles), in dependence on time from blood sampling to SpinBlood. The statistical outliers are presented as circles outside the boxplots. D: Concentration of platelets and larger EVs (P2* particles), and smaller EVs (Pa* and Pb* particles) in blood, EPP, PVRP and PPP. FCM measurements were made in small scale settings (, D).
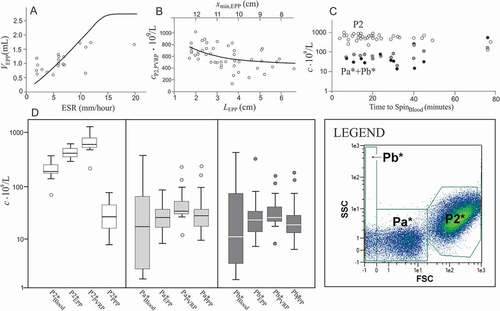
Table II. Average Enrichment factor (E) and Recovery (R) of platelets and CVs (P2 particles) in SpinBlood, SpinEPP and in whole 2-step processing
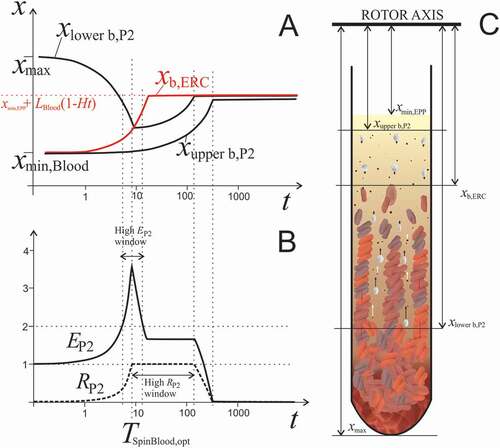
Figure 5. The effect of centrifugation time on redistribution of blood constituents. A: Calculated positions of the upper boundary of erythrocytes xERC, upper boundary of P2 particles xupper b,P2 and lower boundary of P2 particles xlower b,P2 in dependence on centrifugation time (Eqs. (A2.25) and (A2.26), respectively). The model parameters were, xmax = 14 cm, LBlood = 6 cm, Ht = 0.4, αERC = 3.9 × 10⁻⁴ /s, αPLT = 2.5 × 10⁻⁵ /s. At time 0, xupper b,P2 and xb,ERC are at xmin,Blood and xlower b,P2 is at xmax. Due to the centrifugal force, erythrocytes move relatively fast compared to much smaller and lighter platelets and EVs. Erythrocyte boundary xb,ERC moves toward the bottom of the tube and eventually stops at the level determined by the Ht (dotted red line). The counterflow of fluid carries P2 particles in the direction opposite to the flow of erythrocytes. Starting from the bottom of the tube, the lower boundary of P2 particles (xlower b,P2) proceeds toward the erythrocyte boundary (xb,ERC). There is time interval in which enrichment of plasma in P2 particles EP2 is very high (indicated by the high EP2 window). xupper b,P2 moves toward the bottom of the tube at the rate determined by the size and shape of smaller particles. B: Enrichment of homogenized EPP in P2 particles EP2 and their recovery RP2 increases with time as long as platelets and EVs are pushed up by the settling erythrocytes. However, when erythrocytes eventually pack in the pellet and their movement ceases, platelets and EVs are no longer subjected to the drag of the erythrocyte counterflow. The centrifugal pull reverses their direction toward the bottom of the tube and their concentration in EPP decreases. EP2 and RP2 reach their maximum at optimal time TSpinBlood,opt. There is a relatively narrow time interval in which EP2 is very high (larger than 2). Recovery RP2 stays close to 1 in a relatively large time interval due to slow clearance of platelets and EVs from EPP. C: Scheme of the blood cell and EVs dynamics during centrifugation. Due to high concentration in blood, erythrocytes are subjected to direct interactions between each other, resulting in accelerated formation of erythrocyte- and plasma channels. Formation of roleaux increases erythrocyte sedimentation velocity. The arrows indicate the velocity vectors of erythrocytes, platelets and EVs. Erythrocytes closely pack at the bottom of the tube.